skygrid
Plots an additional axis grid on the celestial sphere.
This can be overlaid on the default sky axis grid
so that axes for multiple sky coordinate systems
are simultaneously visible.
The plots are done relative to the View sky system
(viewsys parameter)
defined for the plot as a whole.
Note that some of the configuration items for this plotter, such as grid line antialiasing and the decimal/sexagesimal flag, are inherited from the values set for the main sky plot grid.
Usage Overview:
   layerN=skygrid gridsysN=equatorial|galactic|supergalactic|ecliptic
                  gridcolorN=<rrggbb>|red|blue|... transparencyN=0..1
                  labelposN=Internal|None loncrowdN=<number> latcrowdN=<number>
All the parameters listed here
affect only the relevant layer,
identified by the suffix
N.
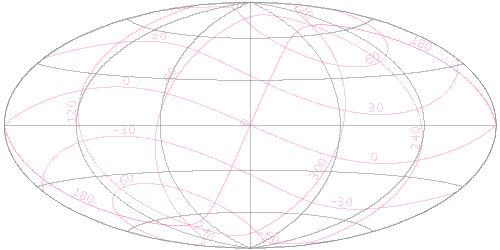
Example:
   stilts plot2sky xpix=500 ypix=250 projection=aitoff
                   viewsys=equatorial labelpos=none sex=false
                   layer1=skygrid gridsys1=ecliptic gridcolor1=HotPink transparency1=0.7 labelpos1=internal
gridcolorN = <rrggbb>|red|blue|... (Color)
The standard plotting colour names are
red, blue, green, grey, magenta, cyan, orange, pink, yellow, black, light_grey, white.
However, many other common colour names (too many to list here)
are also understood.
The list currently contains those colour names understood
by most web browsers,
from AliceBlue to YellowGreen,
listed e.g. in the
Extended color keywords section of
the CSS3 standard.
Alternatively, a six-digit hexadecimal number RRGGBB
may be supplied,
optionally prefixed by "#" or "0x",
giving red, green and blue intensities,
e.g. "ff00ff", "#ff00ff"
or "0xff00ff" for magenta.
[Default: grey]
gridsysN = equatorial|galactic|supergalactic|ecliptic (SkySys)
viewsys parameter
defined for the plot as a whole
to determine what grid lines to plot.
The available options are:
equatorial: J2000 equatorial systemgalactic: IAU 1958 galactic systemsupergalactic: De Vaucouleurs supergalactic systemecliptic: ecliptic system based on conversion at 2000.0[Default: equatorial]
labelposN = Internal|None (SkyAxisLabeller)
The available options are:
Internal: Labels are drawn inside the plot boundsNone: Axes are not labelled[Default: Internal]
latcrowdN = <number> (Double)
[Default: 1]
loncrowdN = <number> (Double)
[Default: 1]
transparencyN = 0..1 (Double)
[Default: 0]