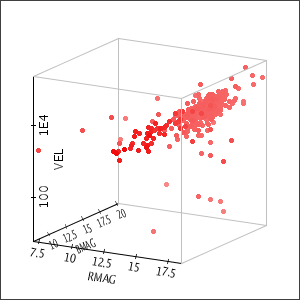
Here are some examples of plot3d in use:
stilts plot3d in=cat.xml xdata=RMAG ydata=BMAG zdata=VEL zlog=true
omode or out value
has been specified, the plot is posted directly
to the graphics display for inspection.
By adding the parameter
out=xyplot.eps
the plot could be written to an
Encapsulated Postscript file instead.
The generated plot is here.
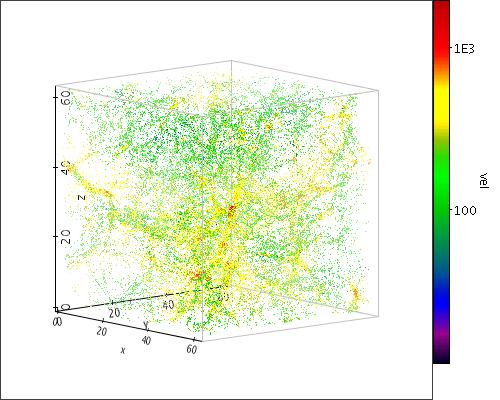
stilts plot3d in=sim1.fits xdata=x ydata=y zdata=z
              cmd='addcol vel "sqrt(velx*velx+vely*vely+velz*velz)"' auxdata=vel auxlog=true
              xpix=500 ypix=400 phi=50 theta=10 out=cube.jpeg
vel
column to the table using the
addcol
filter command, so that the vel column
can be used as the value for the auxdata
parameter.
Alternatively, the given expression for the velocity
could have been used directly as the value of the
auxdata parameter.
Additionally, the phi and
theta parameters are given
to adjust the orientation of the cube.
The generated plot is here.