auto
Paints isolated points in their selected colour but where multiple points in the same layer overlap it adjusts the clour by darkening it. This means that for isolated points (most or all points in a non-crowded plot, or outliers in a crowded plot) it behaves just like flat mode, but it's easy to see where overdense regions lie.
This is like density mode, but with no user-configurable options.
Usage:
shadingN=auto colorN=<rrggbb>|red|blue|...
All the parameters listed here
affect only the relevant layer,
identified by the suffix
N.
Example:
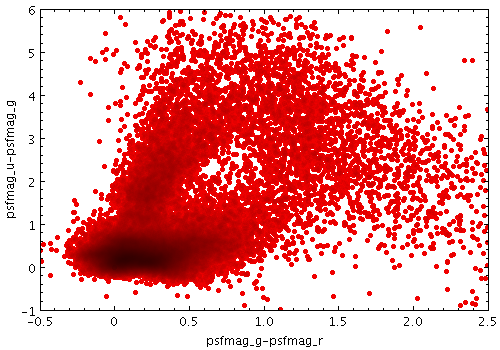
   stilts plot2plane layer1=mark in1=dr5qso.fits
                     x1=psfmag_g-psfmag_r y1=psfmag_u-psfmag_g size1=2
                     shading1=auto
                     xmin=-0.5 xmax=2.5 ymin=-1 ymax=6
Associated parameters are as follows:
colorN = <rrggbb>|red|blue|... (Color)
The standard plotting colour names are
red, blue, green, grey, magenta, cyan, orange, pink, yellow, black, light_grey, white.
However, many other common colour names (too many to list here)
are also understood.
The list currently contains those colour names understood
by most web browsers,
from AliceBlue to YellowGreen,
listed e.g. in the
Extended color keywords section of
the CSS3 standard.
Alternatively, a six-digit hexadecimal number RRGGBB
may be supplied,
optionally prefixed by "#" or "0x",
giving red, green and blue intensities,
e.g. "ff00ff", "#ff00ff"
or "0xff00ff" for magenta.
[Default: red]