The Legend control (![]() )
is always visible in the plot Control Panel.
It allows you to configure whether and how the plot legend appears.
)
is always visible in the plot Control Panel.
It allows you to configure whether and how the plot legend appears.
This control has two tabs, Style and Location.
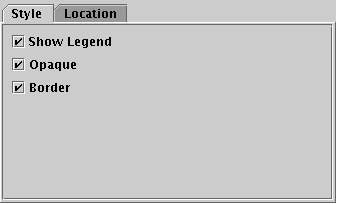
Legend control Style tab
The Style tab configures the appearance of the legend panel, and has the folowing options:
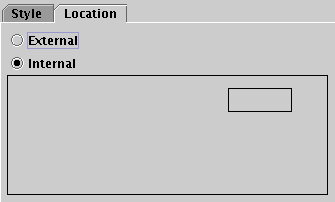
Legend control Location tab
The Location tab configures where on the plot the legend is drawn (if present). There are two options, External and Internal. If Internal is chosen, then a control is activated showing a small box inside a large box. Drag the small box around with the mouse to change the position of the legend inside the plot bounds.
Note the font used in the legend is currently controlled by the font from the Axes selector.