Next Previous Up Contents
Next: Link2 Form
Up: Plot Forms
Previous: Densogram Form
The Gaussian form ( )
plots a best fit Gaussian to the histogram of a sample of data.
In fact, all it does is to calculate the mean and standard deviation
of the sample, and plot the corresponding Gaussian curve.
The mean and standard deviation values are reported by the plot
(see below).
)
plots a best fit Gaussian to the histogram of a sample of data.
In fact, all it does is to calculate the mean and standard deviation
of the sample, and plot the corresponding Gaussian curve.
The mean and standard deviation values are reported by the plot
(see below).
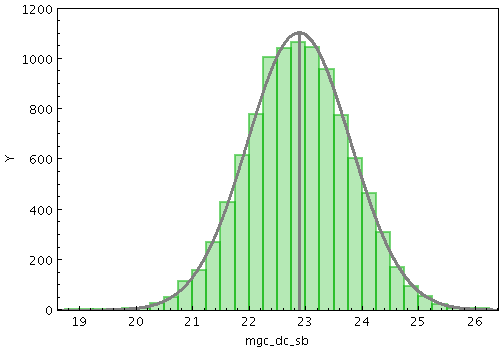
Example Gaussian plot
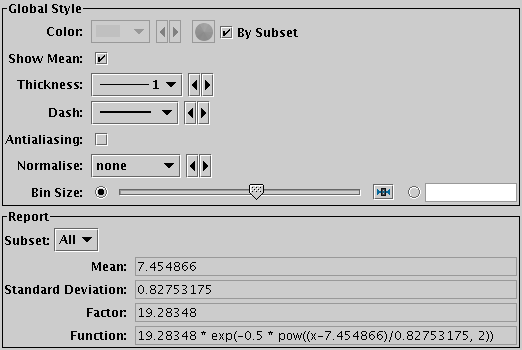
Gaussian fit configuration panel
These options always appear in the form configuration panel:
-
Show Mean
- If true, this will cause the mean value to be indicated by
a vertical line.
-
Thickness
- Controls line thickness.
-
Dash
- Controls the dash pattern of the line (solid, dots, dashes etc).
-
Antialiasing
- If true, lines are antialiased, which makes them look smoother
on the screen or bitmapped export images.
Has no effect on vector export images (PDF, SVG, EPS).
And these options appear in the form configuration panel for the Plane window,
or the
Bins control ( )
for the Histogram window:
)
for the Histogram window:
-
Normalise
- Defines how the histogram is scaled vertically to map its height
to data coordinates. The normalisation options match those for
the histogram form,
so that if the same normalisation and bin size
is chosen here, the plotted curve will be a best fit to the
shape of the corresponding histogram bars.
-
Bin Size
- Defines the notional size of the bins of a histogram which
the plotted Gaussian should match. This option is used only to
affect the vertical scaling, and only has effect for certain
values of the Normalise option.
As well as drawing the line onto the plot,
the calculated fitting coefficients are
displayed at the bottom of the form configuration panel,
under the heading Report.
Note the coefficients are calculated by subset, and
are only displayed for one subset at a time.
To see the calculated values, select the subset of interest in
the Subset selector.
The reported items are:
-
Mean
- The mean of the data set.
-
Standard Deviation
- The standard deviation of the data set.
-
Factor
- The scaling factor applied to the basic exponential function
to yield the actual function plotted in data coordinates.
-
Function
- The actual function plotted; this includes the numeric values
shown by the other report items, and defines exactly what they mean.
This expression uses topcat's expression language,
and can be used (for instance) directly in the
Function plotter.
Next Previous Up Contents
Next: Link2 Form
Up: Plot Forms
Previous: Densogram Form
TOPCAT - Tool for OPerations on Catalogues And Tables
Starlink User Note253
TOPCAT web page:
http://www.starlink.ac.uk/topcat/
Author email:
m.b.taylor@bristol.ac.uk
Mailing list:
topcat-user@jiscmail.ac.uk