Next Previous Up Contents
Next: Defining Subsets Graphically
Up: Plot Window Overview
Previous: Navigation
Most, but not all, of the available
layer controls
are concerned with plotting table data in some way or other.
In general, these allow you to set up a way to generate a plot layer
(some generated graphics)
from some selected columns of a given table with a chosen style.
However, if you have more than one Row Subset
for a given table, a single control can be used to generate several
layers, one for each subset.
In most cases it makes sense to have the graphics generated by
the different subsets configured similarly, but still visually
distinguishable.
These table layer controls generally have three tabs:
Position, Subsets and Form.
The Position tab is for specifying coordinates,
and depends on the specific type of the plot and the layer control.
The Subsets and Form tabs control which
row subsets are plotted and how they are displayed,
and a description of how they are arranged follows below.
Position Tab
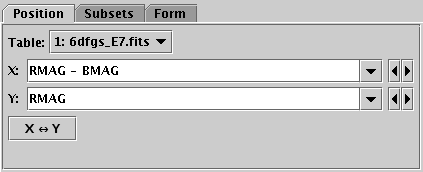
Position tab of a table data layer control
The Position tab lets you specify a table and
a basic set of coordinates for the positions to plot.
The details of how the data point at each of those positions is
represented, including in some cases
more coordinate values (e.g. for error bar sizes etc),
are specified in the other tabs (usually Form).
Subsets Tab
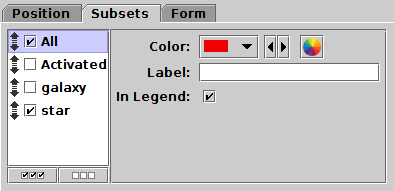
Subsets tab of a table data layer control
The Subsets tab lists the defined Row Subsets for
the table you have selected in the Position tab
(see the Subsets window).
The subsets All and Activated are always present;
others may or may not be depending on whether any have been defined.
Note that actions you take in the plot (for instance selecting
a new subset by region)
can result in new entries being added to this list.
The list on the left names the subsets with an activation checkbox
and a grab handle; the panel on the right gives the detail for the
currently selected subset. Select a subset to see/change its detail
by clicking on it.
For each subset you can select:
- Whether it is plotted (using the activation checkbox)
- The plotting sequence (by dragging it up and down using
its grab handle)
- The default plotting colour
- The label with which it is annotated in the legend (if visible)
- Whether it appears in the legend at all
Although you can select plotting colours in the
Form tab as well,
it's generally better to do it here since this changes the colour of
all the forms plotted for a given subset, rather than one form at a time.
The little
Show/
Hide All
(

/

) buttons at the bottom of the list
can be used as a convenience to make all the subsets visible or invisible
at once (which might be useful if you have lots of subsets).
Form Tab
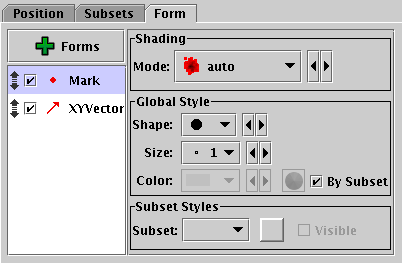
Form tab of a table data layer control
The Form tab lets you control how the data coordinates
specified in the Position tab will be used to
generate graphics on the screen.
On the left is a stack of different Form types that will each be plotted;
a default item Mark is usually included to start with,
but you can add more from the  Forms menu button.
Each form in this stack can be turned on or off individually by clicking
its activation checkbox, dragged up and down using its grab handle,
or deleted using the
Forms menu button.
Each form in this stack can be turned on or off individually by clicking
its activation checkbox, dragged up and down using its grab handle,
or deleted using the  Remove Selected Form
item from the Forms menu.
Remove Selected Form
item from the Forms menu.
When you select a form by clicking on it in the stack,
a configuration sub-panel will appear on the right hand side of this panel.
This allows you to select style information
to determine the details of how the plot will look for each layer,
and sometimes also reports information calculated by the plot.
The details differ greatly between forms, but they
generally contain two sub-panels for defining the style details,
Global Style and Subset Styles:
-
Global Style
- Controls the style details for the chosen form, for instance
marker shape and size. Options here affect all subsets,
though by default the colour is taken from the Subsets tab.
If you want to set the colour the same for all subsets, uncheck the
By Subset checkbox which will activate the
Colour selector.
-
Subset Styles
- If you want to have different subsets represented with different
styles, for instance different shapes for different subsets,
you can select a subset here and alter style details for
that subset only, overriding the Global settings above.
The Visible checkbox indicates and controls
whether the subset selected for specific configuration is
currently visible in the plot.
Next Previous Up Contents
Next: Defining Subsets Graphically
Up: Plot Window Overview
Previous: Navigation
TOPCAT - Tool for OPerations on Catalogues And Tables
Starlink User Note253
TOPCAT web page:
http://www.starlink.ac.uk/topcat/
Author email:
m.b.taylor@bristol.ac.uk
Mailing list:
topcat-user@jiscmail.ac.uk