Here are some examples of plot2d in use:
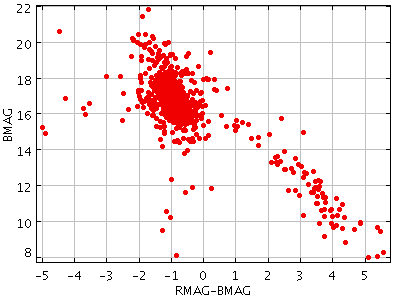
stilts plot2d in=cat.xml xdata=RMAG-BMAG ydata=BMAG
omode or out value
has been specified, the plot is posted directly
to the graphics display for inspection.
By adding the parameter
out=xyplot.eps
the plot could be written to an
Encapsulated Postscript file instead.
The generated plot is here.
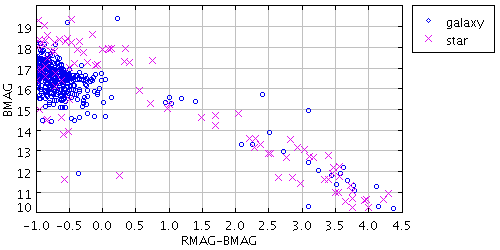
stilts plot2d in=6dfgs_mini.xml xdata=RMAG-BMAG ydata=BMAG
              subset1=SGFLAG==1 name1=galaxy colour1=blue   shape1=open_circle
              subset2=SGFLAG==2 name2=star   colour2=e010f0 shape2=x size2=3
              xlo=-1 xhi=4.5 ylo=10 yhi=20 xpix=500 ypix=250
              out=xyplot2.png
1" and "2"
with separate sets of parameters applying to each.
The selections for the sets are given by the
subset* parameters;
set 1 is those rows with the SGFLAG column equal to 1 and
set 2 is those rows with the SGFLAG column equal to 2.
The boundaries of the plot in data coordinates
are set explicitly rather than being determined from
the data (this is faster)
and the plot size in pixels is also set explicitly
rather than taking the default values.
Output is to a PNG file.
The generated plot is here.
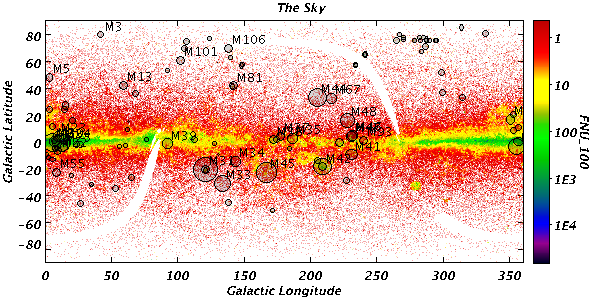
stilts plot2d in1=iras_psc.fits cmd1='addskycoords fk5 galactic RA DEC GLON GLAT'
              xdata1=GLON ydata1=GLAT
              auxdata1=FNU_100 auxlog=true auxflip=true size1=0 transparency1=3
              in2=messier.xml   cmd2='addskycoords fk5 galactic RA DEC GLON GLAT'
              xdata2=GLON ydata2=GLAT
              txtlabel2=RADIUS>16?("M"+ID):"" cmd2='addcol SIZE sqrt(RADIUS/2)'
              xerror2=SIZE yerror2=SIZE
              subset2a=true hide2a=true colour2a=black errstyle2a=ellipse
              subset2b=true hide2b=true colour2b=black errstyle2b=filled_ellipse
                            transparency2b=6
              xlabel='Galactic Longitude' ylabel='Galactic Latitude' title='The Sky'
              legend=false grid=false fontsize=12 fontstyle=bold-italic
              xlo=0 xhi=360 ylo=-90 yhi=+90 xpix=600 ypix=300
              out=skyplot.png
The generated plot is here.