Here are some examples of plothist in use:
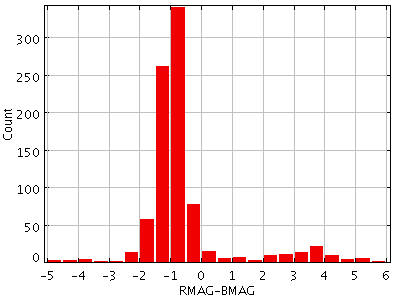
stilts plothist in=cat.xml xdata=RMAG-BMAG
The generated plot is here.
stilts plothist in=cat.xml xdata=RMAG-BMAG ofmt=eps-gzip out=hist.eps.gz
The generated plot is here.
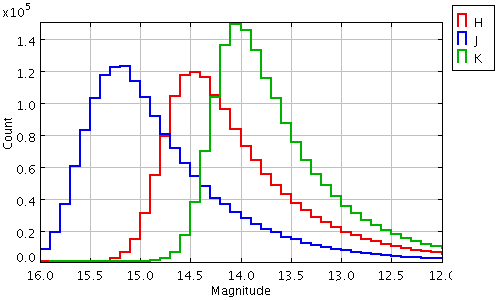
stilts plothist inJ=2mass_xsc.fits xdataJ=j_m_k20fe barstyleJ=tops
                inH=2mass_xsc.fits xdataH=h_m_k20fe barstyleH=tops
                inK=2mass_xsc.fits xdataK=k_m_k20fe barstyleK=tops
                binwidth=0.1 xlo=12 xhi=16 xflip=true xlabel=Magnitude xpix=500
                out=2mass.png
J",
"H" and
"K"
so these suffixes appear on all the dataset-dependent
parameters which are supplied.
The binwidth and X range are specified explicitly
rather than leaving them to be chosen automatically
by examining the data.
The generated plot is here.