spheregrid
Plots a spherical grid around the origin of a 3-d plot. The radius of the sphere can be configured explicitly, otherwise a suitable default value (that should make at least some of the grid visible) will be chosen.
Usage Overview:
   layerN=spheregrid radiusN=<number> gridcolorN=<rrggbb>|red|blue|...
                     thickN=<pixels> nlonN=<int-value> nlatN=<int-value>
All the parameters listed here
affect only the relevant layer,
identified by the suffix
N.
Example:
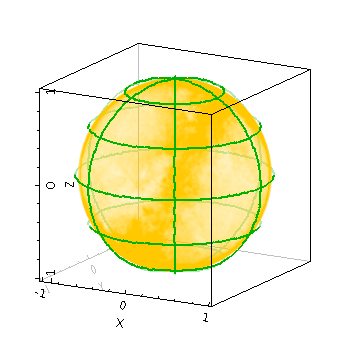
   stilts plot2sphere legend=false xpix=350 ypix=350
                      layer1=mark in1=tgas_source.fits lon1=ra lat1=dec r1=1
                      shading1=transparent opaque1=850 color1=orange
                      layer2=spheregrid gridcolor2=green thick2=2
gridcolorN = <rrggbb>|red|blue|... (Color)
The standard plotting colour names are
red, blue, green, grey, magenta, cyan, orange, pink, yellow, black, light_grey, white.
However, many other common colour names (too many to list here)
are also understood.
The list currently contains those colour names understood
by most web browsers,
from AliceBlue to YellowGreen,
listed e.g. in the
Extended color keywords section of
the CSS3 standard.
Alternatively, a six-digit hexadecimal number RRGGBB
may be supplied,
optionally prefixed by "#" or "0x",
giving red, green and blue intensities,
e.g. "ff00ff", "#ff00ff"
or "0xff00ff" for magenta.
[Default: grey]
nlatN = <int-value> (Integer)
[Default: 2]
nlonN = <int-value> (Integer)
[Default: 3]
radiusN = <number> (Double)
[Default: -1]
thickN = <pixels> (Integer)
[Default: 1]