Next Previous Up Contents
Next: SkyCorr Form
Up: Plot Forms
Previous: SkyEllipse Form
The XYCorr ( ) form
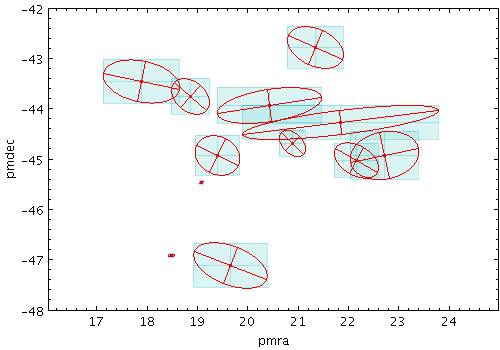
plots an error ellipse (or rectangle or other similar figure)
defined by errors in the X and Y directions,
and a correlation between the two errors.
The supplied correlation is a dimensionless value in the range -1..+1
and is equal to the covariance divided by the product
of the X and Y errors. The covariance matrix is thus:
   [  xerr*xerr         xerr*yerr*xycorr  ]
   [  xerr*yerr*xycorr  yerr*yerr         ]
This plot type is suitable for use with the
<x>_error and
<x>_<y>_corr
columns in the Gaia source catalogue.

Example XYCorr plot

XYCorr form configuration panel
The configuration options are:
-
Shading Mode
- See Appendix A.4.6.
-
X/Y Error
- The error along the horizontal and vertical directions,
as column names or expressions.
-
XY Correlation
- Correlation beteween the errors in the horizontal and vertical
directions.
This is a dimensionless quantity in the range -1..+1,
and is equivalent to the covariance divided by the product
of the X and Y error values themselves.
It corresponds to the
x_y_corr values
supplied in the Gaia source catalogue.
-
Ellipse
- Ellipse graphical representation, selected from a range of options
(includes also rectangles, crosses etc).
-
Thickness
- Controls the line thickness used when drawing polygons.
Zero, the default value, means a 1-pixel-wide line is used.
Larger values make drawn lines thicker, but note changing
this value will not affect all shapes, for instance filled
polygons contain no line drawings.
-
Scale
- Adjusts the size of variable-sized markers like vectors and ellipses.
The default value is 1, smaller or larger values multiply
the visible sizes accordingly.
-
Autoscale
- Determines whether plotted ellipses are automatically scaled
to have a sensible size.
If true, then the sizes of all the ellipse markers are examined,
and some dynamically calculated factor is applied to them all to make
them a sensible size (by default, the largest ones will be a few tens
of pixels).
If false, the sizes will be the actual input values interpreted
in data coordinates.
If auto-scaling is on, then markers will keep approximately the same
screen size during zoom operations; if it's off, they will keep the
same size in data coordinates.
Next Previous Up Contents
Next: SkyCorr Form
Up: Plot Forms
Previous: SkyEllipse Form
TOPCAT - Tool for OPerations on Catalogues And Tables
Starlink User Note253
TOPCAT web page:
http://www.starlink.ac.uk/topcat/
Author email:
m.b.taylor@bristol.ac.uk
Mailing list:
topcat-user@jiscmail.ac.uk
![]() ) form
plots an error ellipse (or rectangle or other similar figure)
defined by errors in the X and Y directions,
and a correlation between the two errors.
) form
plots an error ellipse (or rectangle or other similar figure)
defined by errors in the X and Y directions,
and a correlation between the two errors.

