Documentation
- Introduction
- Command-line Tools
- System Properties
- GUI Features
- Profiles
- Debugging Aids
- Bridge
- API Overview
- Javadocs
- Deployment
- Downloads
- Source Repository
- Change Log
- Project Info

JSAMP offers a graphical view of SAMP status in two basic contexts:
These facilities are available both using the command-line clients described in commands and directly from the API. The classes you use are different for the hub and client views, but they share similar class hierachies and graphical representations.
In both cases, there are currently three levels of GUI which can be used:
Each level facility places more load on the implementation, though except for very high message volumes, probably even the message tracker will not slow things down appreciably.
Some more discussion and screenshots of these features are given below. For detailed information on exactly what components and models are available in each case, consult the relevant javadocs.
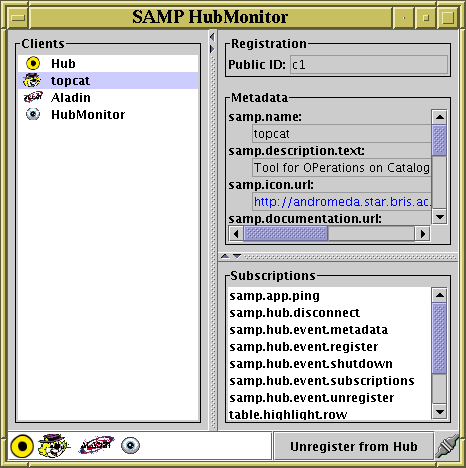
The client list keeps track of the clients currently registered and their associated metadata and subscriptions. Some ready-to-use components which display this information are available; the following HubMonitor screenshot shows these:

The upper left part is a JList of clients with a panel showing the metadata and subscriptions for a selected client on the right. The icon panel in the lower left part gives a more compact display of the currently registered clients. In both cases these components automatically update themselves as clients register and unregister. There is also a register/unregister toggle button and connection status icon at the bottom right.
You can also obtain the ListModel which contains the Client objects for your own custom use if you prefer not to use these components as provided.
The message tracker classes as well as showing the registered clients and their metadata and subscriptions, also keep track of which clients have sent messages to which others, and whether successful responses or other outcomes have resulted. In the case of the hub, all messages from any client to any other can be seen; for the client classes, only those messages sent/received by the client using those classes are visible, because of the SAMP architecture.
The message tracker windows show a tabbed panel. One tab shows the client list as for the earlier example, with the change that a representation of what messages are currently (or recently) in progress is shown after each client's name: little triangles indicate messages received from/sent to to each client (according to whether they are on the left/right of the circle). The triangles change colour etc according to the status of the message in question - hovering the mouse over them gives a tooltip with some more information. You can also obtain a small standalone component which contains just this graphical panel giving message status. This is what the message tracker hub GUI client tab looks like:
Another tab shows a window which gives more detail on messages sent/received. For each message, a summary row is given in a table, and more detail is shown in a panel below, including the complete message and response contents. The messages are retained in the table for a little while after they have completed to allow them to be examined, and then disappear automatically. The message detail tab for the hub looks like this:
You can also obtain the various ListModels containing message Transmission information if you want to construct your own custom components based on these.