Next Previous Up Contents
Next: Sphere Plot Window
Up: Cube Plot Window
Previous: Cube Navigation
The Axes control ( ) for the
cube plot window has the following tabs:
) for the
cube plot window has the following tabs:
Coords Tab
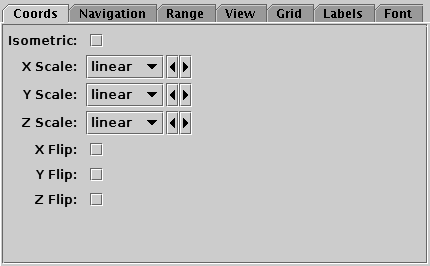
Coords tab of the cube Axes control
The Coords tab controls the axis coordinates.
It has the following options:
-
Isometric
- If selected, the scaling will be the same on the X, Y and Z axes,
so that positions will retain their natural position
in 3-d Cartesian space.
When unselected, the three axes will be scaled independently,
so that the positions may be squashed in some directions.
This option is ignored if there is a mix of linear and logarithmic axes.
-
X/Y/Z Scale
- Selects scaling (linear, log, asinh, symlog) for the X/Y/Z axes.
See Appendix A.4.2.4.
-
X/Y/Z Flip
- If selected, X/Y/Z axis coordinate axes run in the
opposite direction to normal.
Navigation Tab
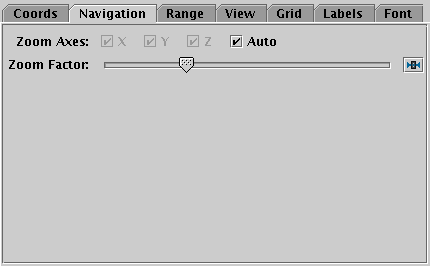
Navigation tab of the cube Axes control
The Navigation tab controls details of how the
navigation works.
It has the following options:
-
Zoom Axes
- By default the Auto setting is in effect.
This means that the mouse wheel zooms around the center of the cube,
and right-button drag zooms in the two dimensions
most closely aligned with the plane of the screen, with the reference
position set by the initial position of the mouse.
If Auto is unset,
then all zoom operations are around the cube center,
and affect the axes indicated by the X/Y/Z checkboxes.
-
Zoom Factor
- Controls the factor by which each zoom action zooms the plot.
Moving this slider to the left/right makes the mouse more/less sensitive
(one wheel click or dragging a fixed distance has more/less zoom effect).
Range Tab
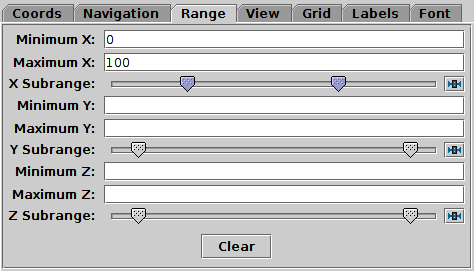
Range tab of the cube Axes control
The Range tab provides manual configuration of the
visible range of the plot. Making changes to this tab will reset
the visible plot range, but not vice versa - zooming and panning
in the usual way will not change the settings of this panel.
Filling in the Minimum/Maximum
fields for one or more axes will
constrain the corresponding range of the visible data.
The limits corresponding to any of those fields that are left blank
will initially be worked out from the data.
The Subrange double-sliders restrict the ranges
within the (explicit or automatic) min/max ranges.
Note you can move both sliders at once by grabbing a position between the two.
The Clear button resets all the fields.
View Tab
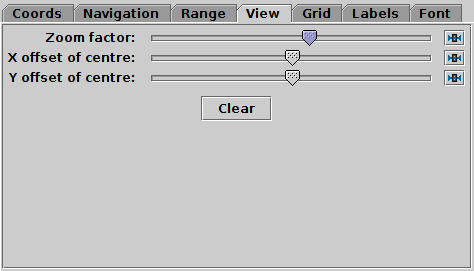
View tab of the cube Axes control
The View tab can configure how the cube containing
the data is viewed in the plot window, though it does not control
the content of the cube.
-
Zoom factor
- Sets the magnification of the cube wireframe itself, without
affecting the data volume it contains. This cannot be done with
the mouse.
-
X/Y offset of centre
- Controls where on the screen the cube wireframe is centred.
This cannot be done with the mouse.
Grid Tab
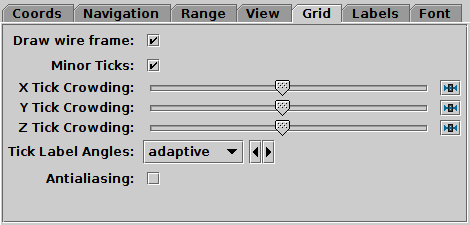
Grid tab of the cube Axes control
The Grid tab configures the appearance of the
cube wire frame enclosing the data volume.
-
Draw wire frame
- Whether the enclosing cube is drawn at all.
-
Minor Ticks
- If set, minor (unlabelled) tick marks will be drawn between the
major (labelled) ones.
-
X/Y/Z Tick Crowding
- Use the slider to influence how many tick marks are draw on each axis.
-
Tick Label Angles
- Controls orientation of numeric labels on the axes.
By default they are drawn adaptively:
horizontally where possible,
but may be angled to accommodate more labels if crowding is high.
But you can choose to fix the orientation
horizontal or angled instead.
-
Antialiasing
- Controls whether grid lines will be drawn antialiased
(smoothed) or not. This option does not affect exported plots.
Labels Tab
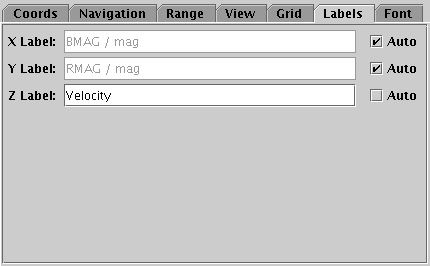
Labels tab of the cube Axes control
The Labels tab controls the text labels on the axes.
If the Auto checkbox is set, the text will be taken
from one of the data coordinates being plotted on that axis.
To override those with your own axis labels, unset Auto and type
text in to the Label fields.
Font Tab
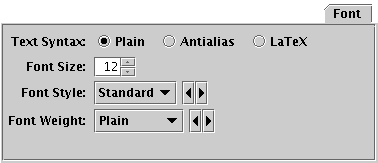
Font tab
The Font tab configures the font used for axis annotation.
It also affects some other things like the legend.
-
Text Syntax
- How to turn the text into characters on the screen.
Plain and Antialias both take the
text at face value, but Antialias smooths the characters.
Antialiased text usually looks nicer, but can be perceptibly slower to plot.
At time of writing, on MacOS antialiased text seems to be required to
stop the writing coming out upside-down for non-horizontal text.
LaTeX interprets the text as LaTeX source code
and typesets it accordingly.
-
Font Size
- Size of the font in points.
-
Font Style
- Style of the font.
-
Font Weight
- Whether the font is plain, bold or italic.
Next Previous Up Contents
Next: Sphere Plot Window
Up: Cube Plot Window
Previous: Cube Navigation
TOPCAT - Tool for OPerations on Catalogues And Tables
Starlink User Note253
TOPCAT web page:
http://www.starlink.ac.uk/topcat/
Author email:
m.b.taylor@bristol.ac.uk
Mailing list:
topcat-user@jiscmail.ac.uk