The Position layer control (![]() )
is available for all the plot types
(except the Corner Plot, which uses the similar
Matrix control).
Most plots start off with one of these in the stack by default,
and you can add a new instance by using the
Add Position Control (
)
is available for all the plot types
(except the Corner Plot, which uses the similar
Matrix control).
Most plots start off with one of these in the stack by default,
and you can add a new instance by using the
Add Position Control (![]() ) button
in the control panel toolbar,
or the corresponding item in the Layers menu.
) button
in the control panel toolbar,
or the corresponding item in the Layers menu.
This is the control which is used for most of the data plotting in the plotting windows. Each instance of this control in the stack does plotting for a particular set of positions from a single table. The set of positions is defined in the Positions tab as a column name or expression for each plot coordinate (e.g. for X and Y in a plane plot). However, the control can generate multiple layers from these positions; the Subsets tab controls which subsets are plotted and how each one is identified, and the Form tab provides many options for what graphics will be plotted based on the positions.
This control is a Table Data control as described in Appendix A.4.2.2. That section explains the Subsets tab; the Position and Form tabs are described in more detail below.
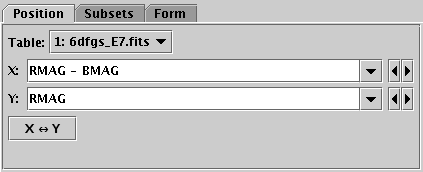
Position tab of Position layer control, for Plane plot
In the Position tab you enter the base position coordinates for each plotted point. This generally means selecting a table and providing a value (table column or expression) for each positional coordinate. When you first open a plot window, TOPCAT gives you a table layer control by default, and attempts to fill in the positional coordinates with some reasonable values from the table (for instance the first few numeric columns).
Note the details of the Position tab will be different for different plot types, for instance the Cube plot has a Z coordinate field alongside X and Y.
For the Plane plot only, there is an X<->Y button that lets you swap the contents of the X and Y fields for convenience. Note that swapping those contents is the only thing it does, it does not for instance swap the log flags for the axes, so the result may not be exactly the same as reflecting the plot about the X=Y line.
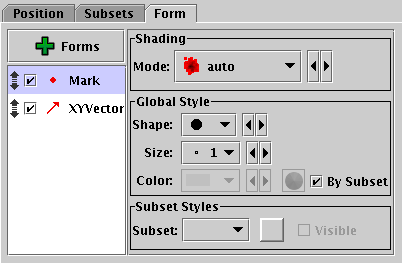
Form tab of Position layer control
The Form tab lets you define how the specified data set is plotted. The stack on the left gives a list of forms currently being plotted, and the panel on the right shows the detailed configuration for the currently selected form.
When first added, the stack contains a single entry, Mark,
which plots a marker of a given fixed shape and size.
The colour is by default determined by the setting in the Subsets tab.
For a simple scatter plot, this is all that you need.
However, there are a number of other forms that you can plot as well
or instead of the simple markers - vectors, error bars, ellipses,
contours, text labels etc. You add a new form to the stack by
clicking on the ![]() Forms button,
which gives you a menu of all the available forms for the current layer control.
You can remove a form by selecting it and selecting
the Remove (
Forms button,
which gives you a menu of all the available forms for the current layer control.
You can remove a form by selecting it and selecting
the Remove (![]() ) button in the same menu.
You can also activate/deactivate the entries in the stack
with the checkbox and move them up and down with the drag handle as usual.
The list of forms that are avaiable depends on the plot type;
the full list is in Appendix A.4.5.
) button in the same menu.
You can also activate/deactivate the entries in the stack
with the checkbox and move them up and down with the drag handle as usual.
The list of forms that are avaiable depends on the plot type;
the full list is in Appendix A.4.5.
The detail panel of each form depends on the form itself. It is divided into the following panels, though not all forms have all the panels.