The SphereGrid layer control (![]() )
plots a spherical net centered on the coordinate origin.
It is available from the
Sphere and
Cube plot windows,
and you can add one of these controls to the stack by using the
Add SphereGrid Control (
)
plots a spherical net centered on the coordinate origin.
It is available from the
Sphere and
Cube plot windows,
and you can add one of these controls to the stack by using the
Add SphereGrid Control (![]() ) button
in the control panel toolbar,
or the corresponding item in the Layers menu.
) button
in the control panel toolbar,
or the corresponding item in the Layers menu.
The plotted grid is currently not labelled, but it can provide orientation to make clear for instance the position of a bounding unit sphere. Its radius can be controlled by a slider or by entering a fixed value. Since the sphere is always centered on the origin, if the whole visible cube is far from the origin, it may be that few or none of the grid lines show up on the plot.
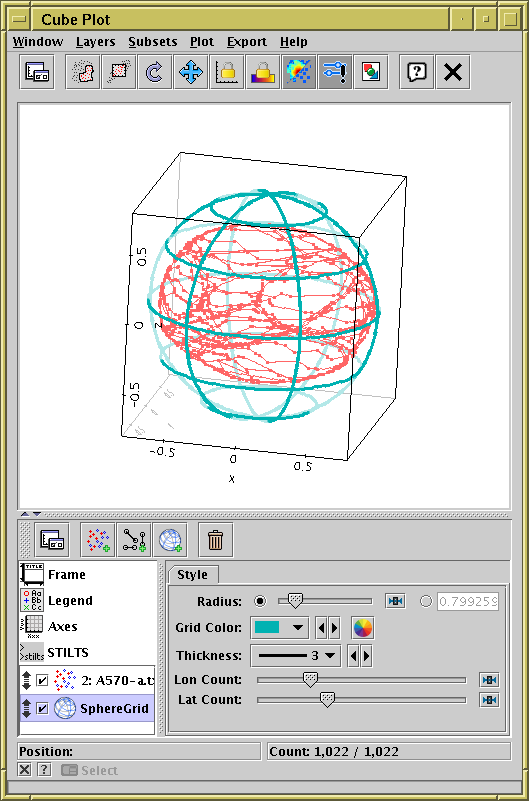
Plot of the XYZ vertices providing surface of an asteroid (48 Doris) with a spherical grid overplotted.
This control has only one tab, Style, with the following fields: