The STILTS control (![]() )
displays the command you would have to issue to the
STILTS package
to reproduce the currently visible plot.
The text is continuously updated to match the currently selected
options, layers and navigation status.
)
displays the command you would have to issue to the
STILTS package
to reproduce the currently visible plot.
The text is continuously updated to match the currently selected
options, layers and navigation status.
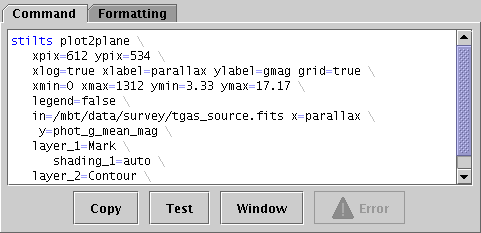
STILTS control Command tab
Unlike the other fixed controls, this one does not provide any options to change the current plot, and if you just want to use TOPCAT interactively you don't need to use it at all. But if you want to be able to regenerate the current plot from the command line or a script without setting it up again from a GUI, for instance to generate publishable figures in a reproducible way, you may find it useful.
STILTS is a command-line interface to all the functionality
that TOPCAT provides from a Graphical User Interface.
Any plot that can be displayed in TOPCAT can also be generated
by providing the right parameters to one of the STILTS
plotting commands.
The STILTS user document provides a full
tutorial introduction
for these commands, as well as detailed documentation for
each of the plotting commands
(plot2plane,
plot2sky, ...)
and many
examples.
However, there is a large number of parameters to configure,
and the command line to reproduce a complex plot can be quite lengthy,
so this control helps you to set up such plots by constructing
the command line corresponding to what you can currently see.
The text displayed in this panel can either be copied directly
to reproduce a plot you have set up interactively, or it can
be used as a basis for later adjustments to some of the parameters.
TOPCAT itself contains the STILTS application, so you don't
need to install any additional software to use it.
You can run it by adding the "-stilts" flag
to a topcat command, or on a Unix-like OS use the stilts
script. If you don't already have it, you can download
stilts
to the directory containing your TOPCAT jar file;
see also SUN/256.
The Invocation formatting options described below
can also help.
You can use this facility with very little understanding of
the details of STILTS.
You just need to copy the text
(using the Copy button or however that's usually done
on your OS)
and paste it onto a system command line or into a script.
Executing the resulting command should then pop up the current plot
in a new window outside of TOPCAT.
If it doesn't work, changing some of the Formatting
options described below
(e.g. setting Invocation to Class-path) may help.
To write the result to a graphics file instead of displaying it
in a window, just add a parameter like out=plot.png
to the end of the line.
The available graphics output formats are listed
in Appendix A.4.2.6.
To understand the generated command and get a better idea of how to tweak the parameters to adjust the plot, you can consult the STILTS user document mentioned above. Just watching how the displayed command changes as you interact with the plot is another way to learn what does what.
This display is available both as a Fixed Control and as a separate window. Both do the same thing, but the window may be convenient if you want to see the way the command text changes as you interact with the GUI in other parts of the fixed or layer controls. To pop up or hide the separate window display, you can either use the Window button at the bottom of the fixed control, or the Export|STILTS Command Window menu item.
Some actions are available from buttons or menu items:
NOTE:
The STILTS command displayed in this panel is not guaranteed
to work from the command line.
There are a few reasons for this.
The STILTS command tries to name the tables you have loaded into TOPCAT.
If they have straightforward filenames this will probably work,
but if a plotted table is for example the result of a match operation
carried out in the current session, it will not exist on disk yet
so it can't be named on the command line.
Similarly, using the names of columns or non-algebraic Row Subsets
created during the current session may result in command lines
that won't work as written,
since those values don't exist in the input files.
In this case you should prepare a table corresponding to the
current TOPCAT state, save that, and edit the STILTS command to
use the name of that file for input (or you can reload the file
and do plots using that). Subsets as such cannot be
saved in this way, but you can achieve much the same thing by
storing subset information in a boolean column
using the To Column action (![]() )
from the Subsets Window.
Note STILTS does not understand TOPCAT's
saved session format.
There may also be bugs in the (rather complex) command-generation code
that cause the command to fail or to generate a slightly different plot.
Hopefully there are not too many of these,
but if you find one please report it.
)
from the Subsets Window.
Note STILTS does not understand TOPCAT's
saved session format.
There may also be bugs in the (rather complex) command-generation code
that cause the command to fail or to generate a slightly different plot.
Hopefully there are not too many of these,
but if you find one please report it.
Another thing that can cause trouble is quoted values
in algebraic expressions, since STILTS quoting syntax
does not always work well on the shell command line.
If there are quoted expressions within a quoted argument it is
sometimes helpful to escape the inner quotes,
e.g. converting
cmd_1='select "gmag > rmag"' to
cmd_1='select \"gmag > rmag\"'.
Another approach is to avoid unnecessary spaces,
which may allow inner quotes to be omitted.
An attempt is made to flag problems in the displayed command line.
Constructions that are suspected or expected to cause trouble
when executing it are highlighted in a different colour.
If the command line itself seems to violate the plotting command syntax,
the Error (![]() ) button will become enabled;
clicking on it will display some indication of what's wrong.
) button will become enabled;
clicking on it will display some indication of what's wrong.
However, the best way to test whether a displayed command will work
is to copy and paste it onto an actual command line and try to run it.
If it works, the plot will show up in a new window.
To export this into a graphic file, simply add or modify the
out parameter (e.g. out=tc-plot.pdf).
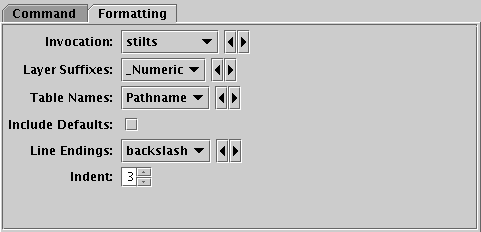
STILTS control Formatting tab
The Formatting tab gives you various options to adjust how the generated STILTS command is displayed in the Command tab. In the popup window version of this display, these options are available as items in the Formatting menu instead.
You may want to adjust these options for personal taste,
or so the output works better with the
command-line environment you're using.
The basic format is intended to work with a Unix-like shell
such as bash;
in most cases the name=value settings should
not be too sensitive to shell-specific syntax,
but it may be useful for instance to change line ending characters.
The available formatting options are:
stilts command itself is introduced.
Options are:
stilts", which will work if a
command with that name is on the execution path.
topcat -stilts", which will work
if the topcat command is on the path.
java executable
is on the path.
layer<suffix>=<layer-type>"
(see SUN/252).
You can choose any form for these suffixes that does not interfere
with the non-suffix parts of the other parameters,
and this option allows you to choose how they are generated.
Options are:
_1, _2, ..._A, _B, ..._a, _b, ...1, 2, ...A, B, ...T" followed by the table identifier.
The identifier is the small integer shown in the table list in the
Control Window.\")
is added at the end of each line;
suitable for bash and other Unix-like shells.^")
is added at the end of each line;
suitable for Windows CMD/.bat scripts.`")
is added at the end of each line;
suitable for Windows PowerShell