Next Previous Up Contents
Next: Gaussian Form
Up: Plot Forms
Previous: KNN Form
The Densogram form ( )
represents smoothed density of data values along the horizontal axis using
a colourmap. This is like a Kernel Density Estimate (smoothed histogram
with bins 1 pixel wide), but instead of representing the data extent
vertically as bars or a line, values are represented by a fixed-size
pixel-width column of a colour from a colour map. A smoothing kernel,
whose width and shape may be varied, is applied to each data point.
)
represents smoothed density of data values along the horizontal axis using
a colourmap. This is like a Kernel Density Estimate (smoothed histogram
with bins 1 pixel wide), but instead of representing the data extent
vertically as bars or a line, values are represented by a fixed-size
pixel-width column of a colour from a colour map. A smoothing kernel,
whose width and shape may be varied, is applied to each data point.
This is a rather unconventional way to represent density data, and this
plotting mode is probably not very useful. But hey, nobody's forcing
you to use it.
This form may be used in either the
Histogram,
Plane or
Time plot windows.
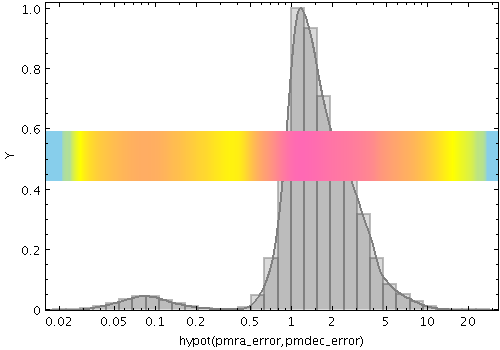
Example Densogram plot
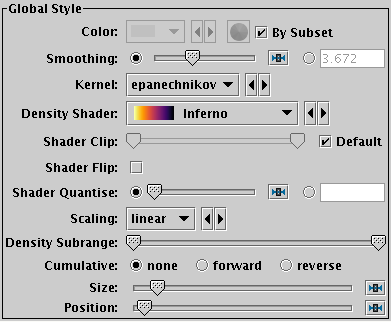
Densogram form configuration panel
These options always appear in the form configuration panel:
-
Colour
- The base colour for the data set.
Only certain shader colour maps respect this value, for others it
is ignored.
-
Density Shader
- The colour map for displaying density values.
There are two types, relative and absolute.
Relative maps have names marked by a star ("*"), and alter the
basic dataset colour, for instance by darkening or lightening it,
while absolute maps (the rest) ignore the basic dataset colour altogether.
For a single-dataset plot, the absolute maps are best, but for
multiple subsets it may be less confusing to use a relative one.
Colour maps are listed in Appendix A.4.7.
-
Shader Clip
- Select a sub-range of the full colour map above.
If the Default checkbox is checked, then all or most
of the colour ramp from the Shader control is used.
If you want to configure the range of colours from the map yourself,
uncheck the Default checkbox, and slide the handles in from the end
of the slider to choose exactly the range you want.
The default range is clipped at one end for colour maps that fade
to white, so that all the plotted colours will be distinguishable
against a white background.
If you don't want that, you can
uncheck Default and leave the handles at the extreme ends of the slider.
-
Shader Flip
- Whether the density scale should map forwards or backwards
into the colour map.
-
Shader Quantise
- Allows the colour map to be quantised.
By default, the colour map is effectively continuous.
If you slide the slider to the right,
or enter a value in the text field,
the map will be split into
a decreasing number of discrete colours. This can be used to generate
a contour-like effect, and may make it easier to trace the boundaries
of regions of interest by eye.
-
Scaling
- Determines the function used to map the range of density values
onto the colour map.
Options are log,
linear,
histogram,
asinh,
square root,
square
arc cosine and
cosine.
-
Density Subrange
- Adjusts the density range over which the colour
map is applied. By default the colour map is scaled using limits
found from the data density in the plot (the most dense few pixels are
ignored), but you can restrict the range using this slider.
-
Size
- Height of the density bar in pixels.
-
Position
- Determines where on the plot region the density bar appears. The value
should be in the range 0..1; zero corresponds to the bottom of the
plot and one to the top.
And these options appear in the form configuration panel for the Plane window,
or the
Bins control ( )
for the Histogram window:
)
for the Histogram window:
-
Smoothing
- Configures the smoothing width for kernel density estimation. This is
the characteristic width of the kernel function to be convolved with
the density to produce the visible plot.
Sliding the slider to the right makes the kernel width larger.
The width in data units is shown in the text field on the right
(if the X axis is logarithmic, this is a factor).
Alternatively you can click the radio button near the text field,
and enter the width in data units directly.
-
Kernel
- The functional form of the smoothing kernel. The functions listed
refer to the unscaled shape; all kernels are normalised to give a
total area of unity.
The available options are:
-
square:
Uniform value: f(x)=1, |x|=0..1
-
linear:
Triangle: f(x)=1-|x|, |x|=0..1
-
epanechnikov:
Parabola: f(x)=1-x*x, |x|=0..1
-
cos:
Cosine: f(x)=cos(x*pi/2), |x|=0..1
-
cos2:
Cosine squared: f(x)=cos^2(x*pi/2), |x|=0..1
-
gauss3: Gaussian truncated at 3.0 sigma:
f(x)=exp(-x*x/2), |x|=0..3
-
gauss6: Gaussian truncated at 6.0 sigma:
f(x)=exp(-x*x/2), |x|=0..6
-
Cumulative
- If set to forward or reverse,
the levels are calculated cumulatively;
each bin includes the counts from all previous bins in the
direction of negative or positive infinity.
Next Previous Up Contents
Next: Gaussian Form
Up: Plot Forms
Previous: KNN Form
TOPCAT - Tool for OPerations on Catalogues And Tables
Starlink User Note253
TOPCAT web page:
http://www.starlink.ac.uk/topcat/
Author email:
m.b.taylor@bristol.ac.uk
Mailing list:
topcat-user@jiscmail.ac.uk