Next Previous Up Contents
Next: SkyDensity Form
Up: Plot Forms
Previous: Contour Form
The Grid form ( )
plots 2-d point data aggregated into rectangular cells on the plotting plane.
You can optionally use a weighting for the points,
and you can configure how the values are combined to produce the
output pixel values (colours).
You can use this layer type in various ways,
including as a 2-d histogram or weighted density map,
or to plot gridded data.
)
plots 2-d point data aggregated into rectangular cells on the plotting plane.
You can optionally use a weighting for the points,
and you can configure how the values are combined to produce the
output pixel values (colours).
You can use this layer type in various ways,
including as a 2-d histogram or weighted density map,
or to plot gridded data.
The X and Y dimensions of the grid cells (or equivalently histogram bins)
can be configured in terms of either the data coordinates
or relative to the plot dimensions.
The shading is done using the shared colour map.
This colour map is used by all currently visible
Grid,
Aux and
Weighted layers.
When at least one such layer is being plotted,
the Aux Axis control
is visible
in the control panel, which allows you to configure the colour map,
range, ramp display etc.
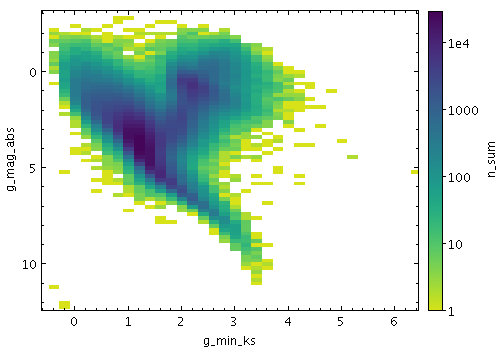
Example Grid plot
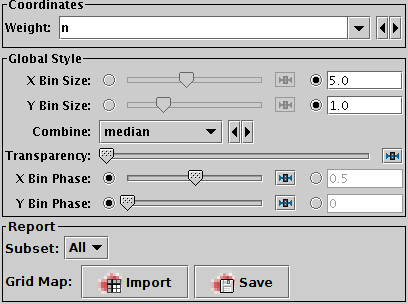
Grid form configuration panel
The configuration options are:
-
Weight
- The weight value applied to each plotted point.
Fill this in with a column name or expression from the table
just like for a positional coordinate.
The exact way this quantity is used depends on the setting of the
Combine control below.
If it's left blank, the weighting is considered to be unity
(all values are 1); this makes sense for some combination types
(e.g.
sum) but not others (e.g. mean).
-
X Bin Size
-
Y Bin Size
- A scale for the horizontal/vertical extent of of the rectangular
bins into which the data is aggregated.
There are two ways to specify this.
If the left-hand radio button is selected, the adjacent slider will
adjust the bin size, which is also affected by the actual width of
the plotting window in pixels. Slide the slider left to get narrower
bins or right to get wider ones.
If the right-hand radio button is selected, you can enter a numeric
value giving the actual extent in data units of the dimension.
If the axis in question is logarithmic, this value is a factor.
-
Combine
- Determines how the Weight values for the
points falling within a given data bin
are combined to produce the numeric value used for that bin's colour.
For unweighted values (a pure density map) it usually makes sense
to use
count or sum.
However, if there is a non-blank Weight coordinate,
one of the other values such as mean may be more revealing.
The following options (some are more useful than others)
are currently available:
-
sum: the sum of all weights
-
sum-per-unit:
the sum of all weights per unit of bin size
-
mean: the mean of all weights
-
median: the median of all weights (can be slow)
-
q1: the first quartile of all weights (can be slow)
-
q3: the third quartile of all weights (can be slow)
-
min: the minimum weight
-
max: the maximum weight
-
stdev: the sample standard deviation of all weights
-
count: the number of points plotted
(weight value is ignored, this is like Density mode)
-
count-per-unit:
the number of points plotted per unit of bin size
(weight value is ignored)
-
hit: one if any point is plotted, blank otherwise
(weight value is ignored, this is like Flat mode)
-
Transparency
- Adjusts the transparency of the filled area.
-
X Bin Phase
-
Y Bin Phase
- Controls where the horizontal/vertical zero point for bins is set.
For instance if your X/Y bin size is 1, it controls whether bin boundaries
on the X/Y axis are at 0, 1, 2, ... or 0.5, 1.5, 2.5, ... etc.
If the slider is at either end of the scale, there will be a bin
boundary at X/Y=0 (linear axis) or X/Y=1 (logarithmic axis).
The Report panel provides information calculated
by the plot:
-
Grid Map
- This allows you to export the grid data that you can see in the plot
in the form of a table.
The table has one row for each plotted cell,
with columns giving the central, lower and upper bounds for each
the X and Y grid coordinates, as well as a column giving the bin value,
corresponding to the colour in the plot.
The Import (
 ) option
loads the data as a new table in the TOPCAT application, and
the Save (
) option
loads the data as a new table in the TOPCAT application, and
the Save ( ) option
lets you save it directly to disk in one of the available table formats.
This information is also available from the Export menu.
) option
lets you save it directly to disk in one of the available table formats.
This information is also available from the Export menu.
Next Previous Up Contents
Next: SkyDensity Form
Up: Plot Forms
Previous: Contour Form
TOPCAT - Tool for OPerations on Catalogues And Tables
Starlink User Note253
TOPCAT web page:
http://www.starlink.ac.uk/topcat/
Author email:
m.b.taylor@bristol.ac.uk
Mailing list:
topcat-user@jiscmail.ac.uk