size
Plots a marker of fixed shape but variable size at each position. The size is determined by an additional input data value.
The actual size of the markers depends on the setting of the
autoscale
parameter.
If autoscaling is off, then the basic size of each marker
is the input data value in units of pixels.
If autoscaling is on, then the data values are gathered
for all the currently visible points, and a scaling factor
is applied so that the largest ones will be a sensible size
(a few tens of pixels).
This basic size can be further adjusted with the
scale factor.
Currently data values of zero always correspond to marker size of zero, negative data values are not represented, and the mapping is linear. An absolute maximum of 100 pixels is also imposed on marker sizes. Other options may be introduced in future.
Note: for marker sizes that correspond to data values in data coordinates, you may find Error plotting more appropriate.
Usage Overview:
   layerN=size shapeN=filled_circle|open_circle|... scaleN=<factor>
               autoscaleN=true|false
               shadingN=auto|flat|translucent|transparent|density|aux|weighted|paux|pweighted <shade-paramsN>
               <pos-coord-paramsN> sizeN=<num-expr> inN=<table>
               ifmtN=<in-format> istreamN=true|false icmdN=<cmds>
All the parameters listed here
affect only the relevant layer,
identified by the suffix
N.
<pos-coord-paramsN>
give a position for each row of the input table.
Their form depends on the plot geometry,
i.e. which plotting command is used.
For a plane plot (plot2plane)
the parameters would be
xN and yN.
The coordinate parameter values are in all cases strings
interpreted as numeric expressions based on column names.
These can be column names, fixed values or algebraic
expressions as described in Section 10.
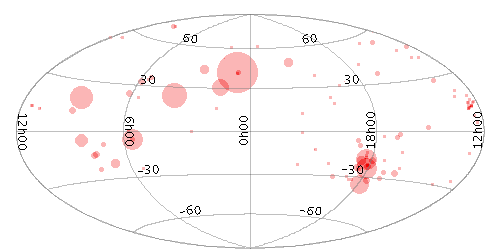
Example:
   stilts plot2sky projection=aitoff xpix=500 ypix=250
                   layer1=size in1=messier.xml shading1=transparent lon1=RA lat1=DEC size1=Radius
autoscaleN = true|false (Boolean)
If auto-scaling is off, then markers will keep exactly the same screen size during pan and zoom operations; if it's on, then the visible sizes will change according to what other points are currently plotted.
Marker size is also affected by the
scale parameter.
[Default: true]
icmdN = <cmds> (ProcessingStep[])
inN.
The value of this parameter is one or more of the filter
commands described in Section 6.1.
If more than one is given, they must be separated by
semicolon characters (";").
This parameter can be repeated multiple times on the same
command line to build up a list of processing steps.
The sequence of commands given in this way
defines the processing pipeline which is performed on the table.
Commands may alternatively be supplied in an external file,
by using the indirection character '@'.
Thus a value of "@filename"
causes the file filename to be read for a list
of filter commands to execute. The commands in the file
may be separated by newline characters and/or semicolons,
and lines which are blank or which start with a
'#' character are ignored.
A backslash character '\' at the end of a line
joins it with the following line.
ifmtN = <in-format> (String)
inN.
The known formats are listed in Section 5.1.1.
This flag can be used if you know what format your
table is in.
If it has the special value
(auto) (the default),
then an attempt will be
made to detect the format of the table automatically.
This cannot always be done correctly however, in which case
the program will exit with an error explaining which
formats were attempted.
This parameter is ignored for scheme-specified tables.
[Default: (auto)]
inN = <table> (StarTable)
-",
meaning standard input.
In this case the input format must be given explicitly
using the ifmtN
parameter.
Note that not all formats can be streamed in this way.:<scheme-name>:<scheme-args>.<" character at the start,
or a "|" character at the end
("<syscmd" or
"syscmd|").
This executes the given pipeline and reads from its
standard output.
This will probably only work on unix-like systems.istreamN = true|false (Boolean)
inN parameter
will be read as a stream.
It is necessary to give the
ifmtN parameter
in this case.
Depending on the required operations and processing mode,
this may cause the read to fail (sometimes it is necessary
to read the table more than once).
It is not normally necessary to set this flag;
in most cases the data will be streamed automatically
if that is the best thing to do.
However it can sometimes result in less resource usage when
processing large files in certain formats (such as VOTable).
This parameter is ignored for scheme-specified tables.
[Default: false]
scaleN = <factor> (Double)
[Default: 1]
shadingN = auto|flat|translucent|transparent|density|aux|weighted|paux|pweighted <shade-paramsN> (ShapeMode)
[Default: auto]
shapeN = filled_circle|open_circle|... (MarkerShape)
The available options are:
filled_circle
open_circle
cross
x
open_square
open_diamond
open_triangle_up
open_triangle_down
fat_circle
fat_cross
fat_x
fat_square
fat_diamond
fat_triangle_up
fat_triangle_down
filled_square
filled_diamond
filled_triangle_up
filled_triangle_down
[Default: filled_circle]
sizeN = <num-expr> (String)
scale
value.
The value is a numeric algebraic expression based on column names as described in Section 10.