xycorr
Plots an error ellipse (or rectangle or other similar figure) defined by errors in the X and Y directions, and a correlation between the two errors.
The supplied correlation is a dimensionless value in the range -1..+1 and is equal to the covariance divided by the product of the X and Y errors. The covariance matrix is thus:
    [  xerr*xerr         xerr*yerr*xycorr  ]
    [  xerr*yerr*xycorr  yerr*yerr         ]
In some cases the supplied data values
give the actual extents in data coordinates
for the plotted ellipses
but sometimes the data is on a different scale
or in different units to the positional coordinates.
As a convenience for this case, the plotter can optionally
scale the magnitudes of all the ellipses
to make them a reasonable size on the plot,
so by default the largest ones are a few tens of pixels long.
This auto-scaling is turned off by default,
but it can be activated with the
autoscale
option.
Whether autoscaling is on or off, the
scale
option can be used to apply a fixed scaling factor.
This plot type is suitable for use with the
<x>_error and
<x>_<y>_corr columns
in the Gaia source catalogue.
Usage Overview:
   layerN=xycorr ellipseN=ellipse|crosshair_ellipse|... thickN=<int-value>
                 scaleN=<factor> autoscaleN=true|false
                 shadingN=auto|flat|translucent|transparent|density|aux|weighted|paux|pweighted <shade-paramsN>
                 xN=<num-expr> yN=<num-expr> xerrN=<num-expr> yerrN=<num-expr>
                 xycorrN=<num-expr> inN=<table> ifmtN=<in-format>
                 istreamN=true|false icmdN=<cmds>
All the parameters listed here
affect only the relevant layer,
identified by the suffix
N.
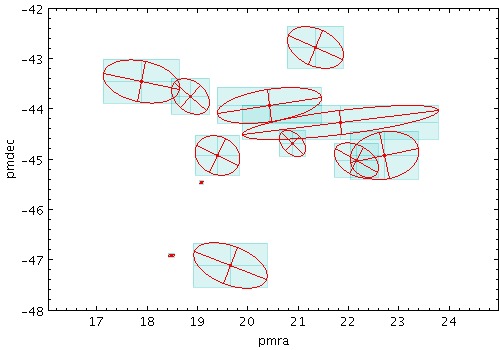
Example:
   stilts plot2plane in=tgas_source.fits icmd='select skyDistanceDegrees(ra,dec,56.9,23.9)<0.4'
                     x=pmra y=pmdec
                     layer1=mark
                     xerrhi2=pmra_error yerrhi2=pmdec_error
                     color2=cyan shading2=transparent
                     layer2a=xyerror errorbar2a=filled_rectangle opaque2a=10
                     layer2b=xyerror errorbar2b=crosshair_rectangle opaque2b=4
                     layer3=xycorr autoscale3=false
                     xerr3=pmra_error yerr3=pmdec_error xycorr3=pmra_pmdec_corr
                     ellipse3=crosshair_ellipse
                     aspect=1
                     xmin=17 xmax=24 ymin=-48 ymax=-42
autoscaleN = true|false (Boolean)
If auto-scaling is on, then markers will keep approximately the same screen size during zoom operations; if it's off, they will keep the same size in data coordinates.
Marker size is also affected by the
scale parameter.
[Default: false]
ellipseN = ellipse|crosshair_ellipse|... (MultiPointShape)
The available options are:
ellipse
crosshair_ellipse
filled_ellipse
rectangle
crosshair_rectangle
filled_rectangle
open_triangle
filled_triangle
lines
capped_lines
arrows
[Default: ellipse]
icmdN = <cmds> (ProcessingStep[])
inN.
The value of this parameter is one or more of the filter
commands described in Section 6.1.
If more than one is given, they must be separated by
semicolon characters (";").
This parameter can be repeated multiple times on the same
command line to build up a list of processing steps.
The sequence of commands given in this way
defines the processing pipeline which is performed on the table.
Commands may alternatively be supplied in an external file,
by using the indirection character '@'.
Thus a value of "@filename"
causes the file filename to be read for a list
of filter commands to execute. The commands in the file
may be separated by newline characters and/or semicolons,
and lines which are blank or which start with a
'#' character are ignored.
A backslash character '\' at the end of a line
joins it with the following line.
ifmtN = <in-format> (String)
inN.
The known formats are listed in Section 5.1.1.
This flag can be used if you know what format your
table is in.
If it has the special value
(auto) (the default),
then an attempt will be
made to detect the format of the table automatically.
This cannot always be done correctly however, in which case
the program will exit with an error explaining which
formats were attempted.
This parameter is ignored for scheme-specified tables.
[Default: (auto)]
inN = <table> (StarTable)
-",
meaning standard input.
In this case the input format must be given explicitly
using the ifmtN
parameter.
Note that not all formats can be streamed in this way.:<scheme-name>:<scheme-args>.<" character at the start,
or a "|" character at the end
("<syscmd" or
"syscmd|").
This executes the given pipeline and reads from its
standard output.
This will probably only work on unix-like systems.istreamN = true|false (Boolean)
inN parameter
will be read as a stream.
It is necessary to give the
ifmtN parameter
in this case.
Depending on the required operations and processing mode,
this may cause the read to fail (sometimes it is necessary
to read the table more than once).
It is not normally necessary to set this flag;
in most cases the data will be streamed automatically
if that is the best thing to do.
However it can sometimes result in less resource usage when
processing large files in certain formats (such as VOTable).
This parameter is ignored for scheme-specified tables.
[Default: false]
scaleN = <factor> (Double)
[Default: 1]
shadingN = auto|flat|translucent|transparent|density|aux|weighted|paux|pweighted <shade-paramsN> (ShapeMode)
[Default: auto]
thickN = <int-value> (Integer)
[Default: 0]
xN = <num-expr> (String)
The value is a numeric algebraic expression based on column names as described in Section 10.
xerrN = <num-expr> (String)
The value is a numeric algebraic expression based on column names as described in Section 10.
xycorrN = <num-expr> (String)
*_corr values
supplied in the Gaia source catalogue.
The value is a numeric algebraic expression based on column names as described in Section 10.
yN = <num-expr> (String)
The value is a numeric algebraic expression based on column names as described in Section 10.
yerrN = <num-expr> (String)
The value is a numeric algebraic expression based on column names as described in Section 10.