Next Previous Up Contents
Next: Axis Scales
Up: Defining Subsets Graphically
Previous: Draw Blob Subset
The Draw Algebraic Subset ( ) action
allows you to select points in a region of the plot by clicking on points
of your choice to mark out a shape.
Different shapes such as polygons and circles are available,
depending on the plot type.
When complete, subsets will be defined with an
algebraic expression which you can see and edit.
This can be particularly useful
(and a better option than the blob)
if you want to refer to the subset outside of the context
of the current session,
for instance in a STILTS command or a published paper.
) action
allows you to select points in a region of the plot by clicking on points
of your choice to mark out a shape.
Different shapes such as polygons and circles are available,
depending on the plot type.
When complete, subsets will be defined with an
algebraic expression which you can see and edit.
This can be particularly useful
(and a better option than the blob)
if you want to refer to the subset outside of the context
of the current session,
for instance in a STILTS command or a published paper.
This action is currently only available in the
Plane, Sky and
Corner plot windows.
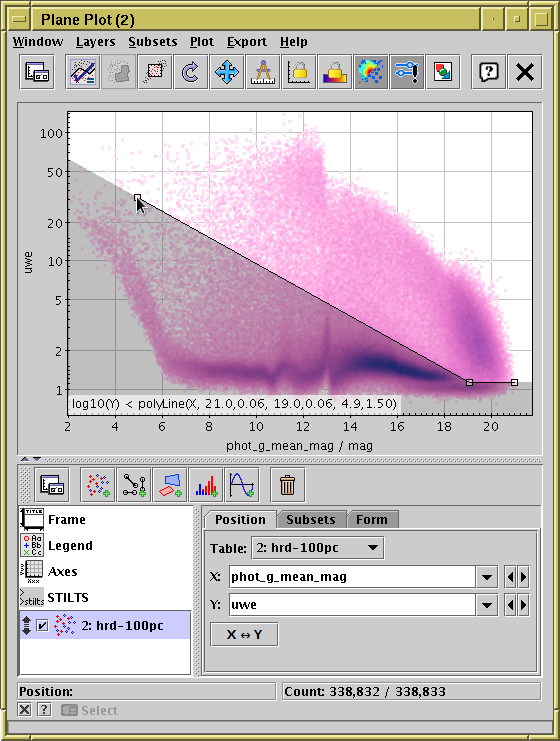
Defining a subset by algebraic drawing.
This shows use of mode Below in the Plane plot.
When you use this action to define a plot region,
it operates in one of a number of inclusion modes,
depending on the plot type. In all cases, you click on one or more
points to define the boundaries of the region.
The available modes are described at the end of this section.
Operation is as follows:
- To start marking out a shape, hit the
button in the toolbar, and a popup window will first ask you
which inclusion mode you want to use.
Alternatively, you can use one of the mode-specific sub-menu
items in the Subsets|Draw Algebraic Subset menu
to choose a mode without the extra popup.
- Once in drawing mode, the toolbar button will appear
with a checkmark over it (
 ),
and a little square marker will appear near the mouse pointer
as long as it's over a suitable part of the plot.
You can then click on the plotting area to mark
the points, and the area thus defined
(according to the mode you have chosen)
will be shaded in grey.
Each point you have clicked on to define the area is marked with
the little square marker.
The algebraic form of the expression for the points entered
so far will be displayed at the bottom of the screen.
A right-click (or Ctrl-click) will remove the most recently-added point.
),
and a little square marker will appear near the mouse pointer
as long as it's over a suitable part of the plot.
You can then click on the plotting area to mark
the points, and the area thus defined
(according to the mode you have chosen)
will be shaded in grey.
Each point you have clicked on to define the area is marked with
the little square marker.
The algebraic form of the expression for the points entered
so far will be displayed at the bottom of the screen.
A right-click (or Ctrl-click) will remove the most recently-added point.
- When you've finished adding points,
click on the button again.
This will pop up the
Multi Algebraic Subset Window,
which displays the algebraic function
corresponding to the region you have outlined,
and offering to create a new subset
(or, if there are multiple datasets plotted, several new subsets)
from it.
The generated expression tries to be as compact and comprehensible
as possible. Precision of the indicated points is determined from
the pixel resolution of the plot, so literal numbers are not more
unwieldy than they have to be.
The available inclusion modes depend on the plot type, as follows:
-
Plane Plot
-
-
Polygon:
Select at least three points to define a closed polygon.
The selected region is inside it.
The expression generated uses the
isInside function.
-
Box:
Defines a rectangle aligned with the axes from two opposite corners.
The expression is just of the form
x>x0 && x<x1 && y>y0 && y<y1.
-
Circle:
Defines a circle in data space.
The first point selected defines the circle center,
and the next point is on the circumference.
Note that in case of one or both axes logarithmic,
the shape in graphics space may not be circular.
The expression is of the form
hypot(x-x0, y-y0)<r,
using the hypot function
(hypot(x,y) = sqrt(x*x+y*y)).
-
Aligned Ellipse:
Defines an ellipse in graphics space aligned with the plot axes.
The first point selected defines the ellipse center,
and the next point is on the boundary.
If later points are selected, they reset the radii.
The expression generated is of the form
square((x-x0)/a) + square((y-y0)/b)<1,
using the square function
(square(x)=x*x).
-
Rotated Ellipse:
Defines an ellipse in graphics coordinates with arbitrary alignment.
The first point selected defines the ellipse center,
the second point is the end of the primary radius,
and the third point defines the extent of the secondary radius.
If later points are selected they reset the secondary radius.
The expression generated is of the form
square(a(x-x0)+b(y-y0))+square(c(x-x0)+d(y-y0))<1,
using the square function
(square(x)=x*x).
-
Below,
Above,
Left,
Right:
The points define a jagged line representing a continuous function
of x (or y) which has, in general, a discontinuous
derivative. If just one point is selected, all the points on
the corresponding side of that single point are included.
Line segments at either end of the line are considered to
continue to infinity - it's easy to understand how this works
by trying it out (or see the figure above).
If only one point is selected, the expression generated
is of the form
y<y0, and
for two points it has the form y<m*x+c.
If there are more points, the special
polyLine function is used.
-
Sky Plot
-
-
Circle:
The first point selected defines the center of a small circle
on the sphere (cone), and the next point is on its radius.
If later points are selected, they reset the radius.
The expression generated uses the
skyDistance function.
-
Ellipse:
Defines an ellipse with arbitrary alignment.
The first point selected defines the ellipse center,
the second point is the end of the primary radius,
and the third point defines the extent of the secondary radius.
If later points are selected they reset the secondary radius.
The expression generated uses the
inSkyEllipse function.
-
Polygon:
Select at least three points to define a closed polygon.
The edges of the polygon are the minor arcs of great circles
(geodesics on the sphere).
The expression generated uses the
inSkyPolygon function.
Next Previous Up Contents
Next: Axis Scales
Up: Defining Subsets Graphically
Previous: Draw Blob Subset
TOPCAT - Tool for OPerations on Catalogues And Tables
Starlink User Note253
TOPCAT web page:
http://www.starlink.ac.uk/topcat/
Author email:
m.b.taylor@bristol.ac.uk
Mailing list:
topcat-user@jiscmail.ac.uk