Sky Plot Window
Sky Plot Window
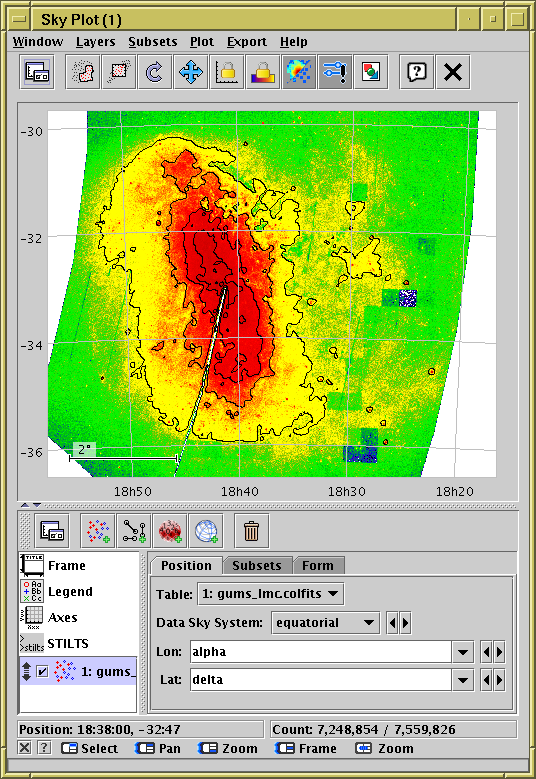
The Sky Plot (![]() )
plots longitude/latitude positions onto the celestial sphere.
It can plot to a number of projections
(currently Sin, Hammer-Aitoff and Plate Carrée).
)
plots longitude/latitude positions onto the celestial sphere.
It can plot to a number of projections
(currently Sin, Hammer-Aitoff and Plate Carrée).
The positional coordinates are Longitude and Latitude, specified in degrees. When supplying them, you can specify an associated Data Sky System (Equatorial, Galactic, Supergalactic or Ecliptic2000). Note that this is the sky system of the data coordinates, not (necessarily) of the plot you want to see. To specify the coordinates you want the data to be plotted on, use the View Sky System option in the Projection tab of the Axes control. However, if you just want to view the data using the same system as the coordinates you are supplying, you can ignore leave these values as their default (both Equatorial) and no conversion will be done.
The sky plot offers the following plot controls:
As well as the standard actions, this window additionally provides the following toolbar buttons:
See the Window Overview for features common to all plotting windows. The following subsections describe navigation and axis configuration.