The Healpix layer control (![]() )
is available from the Sky Plot Window
for plotting tables that represent HEALPix maps on the celestial sphere.
You can add one of these controls to the stack by using the
Add HEALPix Control (
)
is available from the Sky Plot Window
for plotting tables that represent HEALPix maps on the celestial sphere.
You can add one of these controls to the stack by using the
Add HEALPix Control (![]() ) button
in the control panel toolbar,
or the corresponding item in the Layers menu.
) button
in the control panel toolbar,
or the corresponding item in the Layers menu.
Each row in the table must represent a single healpix tile, and a value from that row is used to colour the corresponding region of the sky plot. The resolution (healpix order) of the input table is supplied or may be guessed in order to do the plot, but the plot may be drawn at a degraded order (bigger pixels) if required.
Note this is different from the SkyDensity form, which takes a table containing sky positions, and represents that as a density map on the healpix grid by gathering the rows up into bins. The control described here works on a table for which that binning has already been done, for instance as a prepared sky map data product, by exporting from a SkyDensity layer, or by executing a suitable (GROUP BY healpix_index) database query.
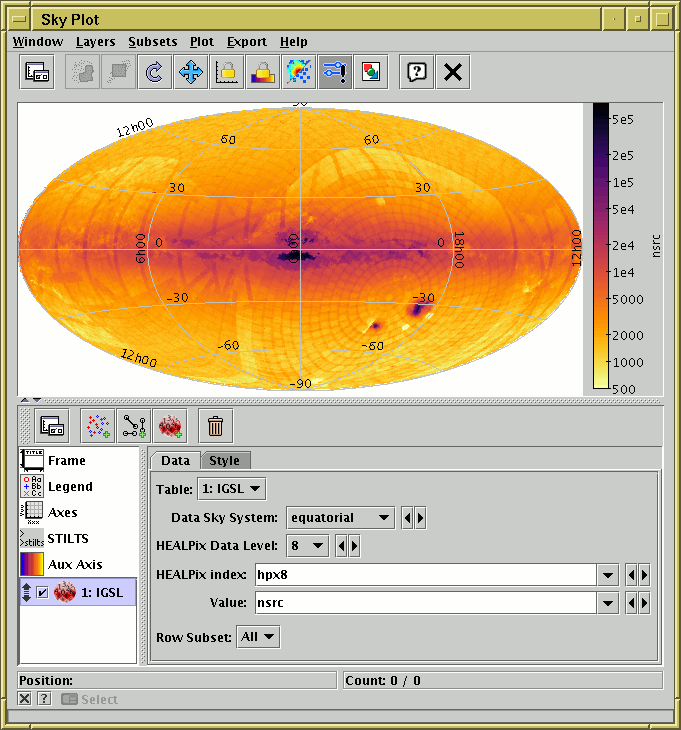
Sky Plot Window with a Healpix layer
This control has two tabs, Data and Style.
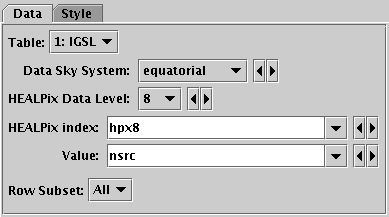
Healpix control Data tab
The Data tab lets you specify the table and columns containing the healpix tile data. It has the following fields:
$0 or $index token,
you would have to write e.g. $index-1.
To control the colour map used to colour the sky tiles,
use the Aux ![]() fixed control.
fixed control.
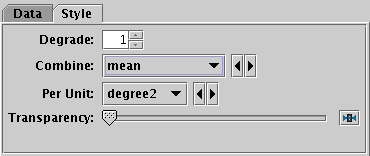
Healpix control Style tab
The Style tab lets you configure additional details of the plot's appearance. It has the following fields:
degrade>0.
For density-like values
(count-per-unit, sum-per-unit)
the scaling is additionally influenced by the
Per Unit option.
The available options are:
sum:
the sum of all the combined values per binsum-per-unit:
the sum of all the combined values per unit of bin sizecount:
the number of non-blank values per bin (weight is ignored)count-per-unit:
the number of non-blank values per unit of bin size
(weight is ignored)mean:
the mean of the combined valuesmedian:
the median of the combined values (may be slow)q1:
the first quartile of the combined values (may be slow)q3:
the third quartile of the combined values (may be slow)min: the minimum of all the combined valuesmax: the maximum of all the combined valuesstdev:
the sample standard deviation of the combined valueshit:
1 if any values present, NaN otherwise (weight is ignored)count-per-unit or sum-per-unit).
If the Combination mode is calculating values per unit area,
this configures the area scale in question.
For non-density-like combination modes
(e.g. sum or mean)
it has no effect.
The available options are:
steradian: steradiandegree2: square degreearcmin2: square arcminutearcsec2: square arcsecondmas2: square milliarcsecuas2: square microarcsec