The Histogram layer control (![]() ),
allows you to make a 1-dimensional histogram-like plots
(weighted and unweighted histograms, various kinds of Kernel Density Estimates).
It is the main control in the
Histogram plot window,
but is also available in the Plane
and Time
plot windows, so you can overplot a histogram on scatter or time plots,
if you can think of some reason to do that.
The Histogram window starts off with one of these controls in the stack by
default, but as usual you can add more by using the
Add Histogram Control (
),
allows you to make a 1-dimensional histogram-like plots
(weighted and unweighted histograms, various kinds of Kernel Density Estimates).
It is the main control in the
Histogram plot window,
but is also available in the Plane
and Time
plot windows, so you can overplot a histogram on scatter or time plots,
if you can think of some reason to do that.
The Histogram window starts off with one of these controls in the stack by
default, but as usual you can add more by using the
Add Histogram Control (![]() ) button
in the control panel toolbar,
or the corresponding item in the Layers menu.
) button
in the control panel toolbar,
or the corresponding item in the Layers menu.
Each instance of this control in the stack can make histogram-like plots of a particular quantity from a particular table. The value to be histogrammed, and optionally an associated weighting term, are defined in the Positions tab using column names or expressions. However, the control can generate multiple layers from these coordinates; the Subsets tab controls which subsets are plotted and how each one is identified, and the Form tab provides many options for what graphics will be plotted based on the sample values specified in the Position tab.
This control is a Table Data control as described in Appendix A.4.2.2. That section explains the Subsets tab; the Position and Form tabs are described in more detail below.
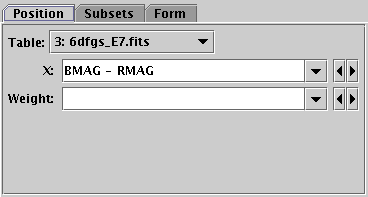
Position tab of Histogram layer control
In the Position tab you enter the value of the X value, the one whose values along the X axis will be used to generate the plots. This may be a table column name or an expression. You may also optionally fill in a column name or expression in the Weight field. This weights the values as they are counted; each table row contributes a height value of the weighting coordinate to the bin into which its X coordinate falls. If Weight is not filled in, a value of 1 is assumed.
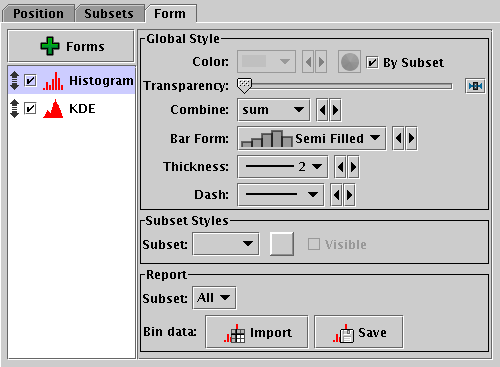
Form tab of Histogram layer control
The Form tab lets you define how the specified data set is plotted. The stack on the left gives a list of forms currently included in the plot, and the panel on the right shows the detailed configuration for the currently selected form.
When first added, the stack contains a single entry,
Histogram, which plots a simple histogram.
The colour is by default determined by the setting in the
Subsets tab.
This may be all you need, but if you want to use other histogram-like
plots such as Kernel Density Estimates, you can add new forms to the stack
using items in the popup menu from the ![]() Forms button
above the stack.
You can remove a form by selecting it and using the
Remove (
Forms button
above the stack.
You can remove a form by selecting it and using the
Remove (![]() ) item in the same menu.
You can also activate/deactivate entries in the stack with the checkbox
and move them up and down with the drag handle as usual.
The available forms are currently
) item in the same menu.
You can also activate/deactivate entries in the stack with the checkbox
and move them up and down with the drag handle as usual.
The available forms are currently
![]() Histogram; some variants on the idea of a Kernel Density Estimate:
Histogram; some variants on the idea of a Kernel Density Estimate:
![]() KDE,
KDE, ![]() KNN,
KNN, ![]() Densogram;
and
Densogram;
and ![]() Gaussian, which effectively plots a Gaussian best fit
to a histogram.
Gaussian, which effectively plots a Gaussian best fit
to a histogram.
The Global Style and Subset Style sub-panels control shared and per-subset configuration specific to the selected form as described in Appendix A.4.2.2.
Histograms have some additional configuration items,
as described in the
Bins (![]() )
fixed control.
When a histogram layer control is used in the
Histogram window,
those configuration items are found in the
Bins fixed control, where they control the settings
for all the histogram layers in the plot.
However, if you use a histogram layer in a
Plane plot,
those items will appear as additional items in the Form tab
and can be controlled separately for each histogram.
)
fixed control.
When a histogram layer control is used in the
Histogram window,
those configuration items are found in the
Bins fixed control, where they control the settings
for all the histogram layers in the plot.
However, if you use a histogram layer in a
Plane plot,
those items will appear as additional items in the Form tab
and can be controlled separately for each histogram.