The Pair Position layer control (![]() )
allows you to plot symbols linking two positions in the plot space
from the same table.
You can add one of these controls to the stack by using the
Add Pair Control (
)
allows you to plot symbols linking two positions in the plot space
from the same table.
You can add one of these controls to the stack by using the
Add Pair Control (![]() ) button
in the control panel toolbar,
or the corresponding item in the Layers menu.
) button
in the control panel toolbar,
or the corresponding item in the Layers menu.
This control is particularly useful for visualising the results
of a crossmatch, and it is used automatically by the
Plot Result (![]() ) option offered by
some of the Match Window results.
If you want to plot pairs of points from different input tables,
you first have to create a joined table by using one of the
crossmatch functions.
) option offered by
some of the Match Window results.
If you want to plot pairs of points from different input tables,
you first have to create a joined table by using one of the
crossmatch functions.
It works in a similar way to the Single Position Layer Control, but the Position tab has fields for not one but two sets of coordinates to fill in.
This control is a Table Data control as described in Appendix A.4.2.2. That section explains the Subsets tab; the Position and Form tabs are described in more detail below.
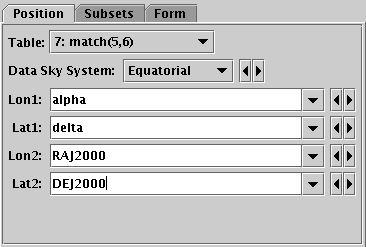
Position tab of Pair Position layer control, for Sky plot
In the Position tab you enter the pair of position coordinates for each plotted pair. This generally means selecting a table and providing a value (table column or expression) for the first and second sets of positional coordinates.
Note the details of the Position tab will be different for different plot types, for instance the Sky plot has Lon1, Lat1, Lon2 and Lat2 fields for the first and second longitude/latitude pairs, while a Plane plot has X1, Y1, X2 and Y2.
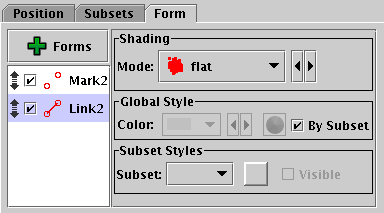
Form tab of Pair Position layer control
The Form tab lets you define how the specified data set is plotted. The list on the left gives a list of forms currently being plotted, and the panel on the right shows the detailed configuration for the currently selected form.
The available forms for a pair plot
(select them using the ![]() Forms button)
are currently
Mark2 (
Forms button)
are currently
Mark2 (![]() )
which draws the points at both ends of the pair, and
Link2 (
)
which draws the points at both ends of the pair, and
Link2 (![]() )
which draws a line linking them.
You can configure these, and select them on or off, separately.
The detail panel for these forms are dependent on the form itself
and are described in more detail in Appendix A.4.5,
but the detail panels are divided into these parts:
)
which draws a line linking them.
You can configure these, and select them on or off, separately.
The detail panel for these forms are dependent on the form itself
and are described in more detail in Appendix A.4.5,
but the detail panels are divided into these parts: