TOPCAT can plot data in one, two or three spatial dimensions, but sometimes the the data which you need to visualise is of higher dimensionality. For this purpose, some of the plotting windows (2D and 3D scatter plots) allow you to control the colouring of plotted points according to values from one or more additional columns (or calculated expressions), which gives you more visual information about the data you are examining.
To use this facility, click the Add auxiliary axis
(![]() ) button in the dataset toolbar (below the plot area
in a plot window).
A new axis selector will appear below the existing spatial ones,
labelled Aux 1 Axis. It has log and flip checkboxes
like the spatial axes, and to the right (you may need to widen the
window or use the scrollbar at the bottom to see it) is a selector depicting a
number of colourmaps to choose from - the default one resembling a
rainbow is usually quite suitable, but you can pick others.
If you enter a column name or expression into the selector, each
plotted point will be coloured according to the value of that quantity
in the corresponding row of data. If that quantity is null for a row,
the corresponding point will not be plotted.
A scale on the right of the plot indicates how the colour map
corresponds to numeric values.
To remove the auxiliary axis and go back to normally-coloured points,
simply click the Remove auxiliary axis (
) button in the dataset toolbar (below the plot area
in a plot window).
A new axis selector will appear below the existing spatial ones,
labelled Aux 1 Axis. It has log and flip checkboxes
like the spatial axes, and to the right (you may need to widen the
window or use the scrollbar at the bottom to see it) is a selector depicting a
number of colourmaps to choose from - the default one resembling a
rainbow is usually quite suitable, but you can pick others.
If you enter a column name or expression into the selector, each
plotted point will be coloured according to the value of that quantity
in the corresponding row of data. If that quantity is null for a row,
the corresponding point will not be plotted.
A scale on the right of the plot indicates how the colour map
corresponds to numeric values.
To remove the auxiliary axis and go back to normally-coloured points,
simply click the Remove auxiliary axis (![]() )
button.
)
button.
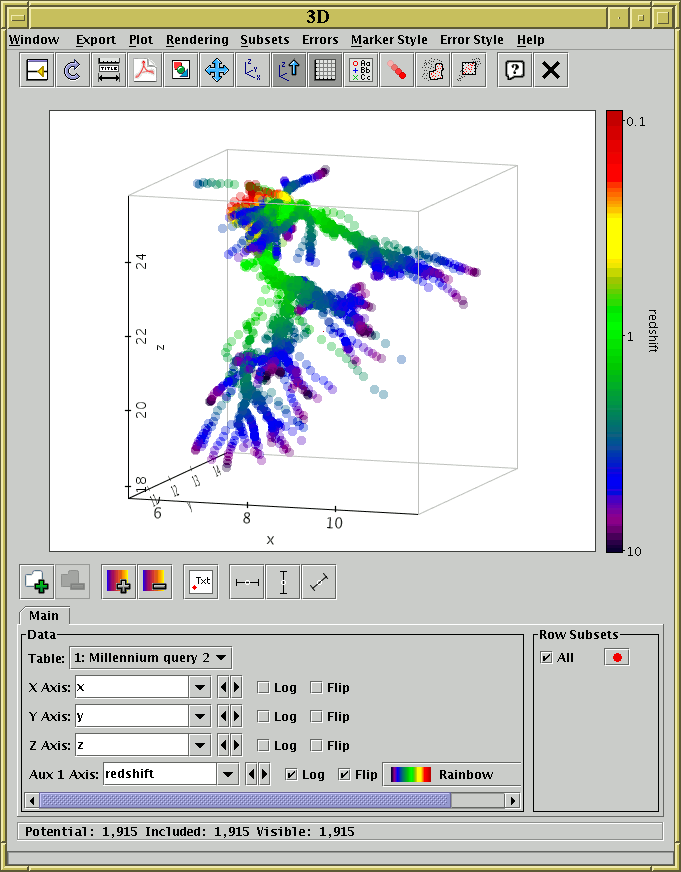
3D plot of simulation data showing X, Y, Z spatial position with the auxiliary axis indicating timestep.
There are two types of colour maps you can choose from: colour fixing and colour modifying. The fixing ones are easiest to understand: the original colour of the point (as drawn in the legend) is ignored, and it is coloured according to the relevant value on the selected auxiliary axis. The colour modifying maps take the original colour and affect it somehow, for instance by changing its transparency or its blue component. These are marked with an asterisk ("*") in the colour map selector. They can be used to convey more information but are often harder to interpret visually - for one thing the shading of the colour bar in the legend will not correspond exactly to the colours of the plotted points.
By using modifying colour maps it is possible to perform plots with more than one auxiliary axis - typically the first one will be a fixing map and subsequent ones will be modifying. So the first auxiliary axis could have the (fixing) Rainbow map, and the second could have the (modifying) Transparency map. The colour alterations are applied in order. It is possible, but pointless, to have multiple fixing maps applied to the same points - the last-numbered one will determine the colour and earlier ones will get ignored. Multiple aux axes can be obtained by clicking the Add auxiliary axis button more than once. When combining several maps some thought has to be given to which ones to use - some good combinations are the three RGB ones or the three YUV ones.
A fairly wide range of colour maps of both kinds is provided by default. If these do not suit your needs, it is possible to provide your own custom colour fixing maps using the lut.files system property - see Section 10.2.3.
It is easy to generate attractive screenshots using auxiliary axes. Making visual sense of the results is a different matter. One visualisation expert tried to dissuade their introduction in TOPCAT on the grounds that the graphics they produce are too hard for humans to interpret - I hope that these plots can assist with some analysis, but it is a somewhat experimental feature which may or may not end up being widely useful. The maximum number of auxiliary axes which can be used together is currently three. This could be increased on request, but if you feel you can generate an intelligible plot using more than this then you're considerably smarter than me.