On the 2-d and 3-d scatter plots you can write text labels adjacent
to plotted points. To do this click the Draw Labels
(![]() ) button in the dataset toolbar (below the plotting area
in the plot window). This will reveal a new Point Labels
selector below the existing spatial ones.
Using this you can select any of the table columns (not just the
numeric ones as for the other selectors), or give a string or
numeric expression involving them. When this selector is filled
in, every point in the dataset which has a non-blank value for
this quantity will have it written next to the point on the display.
) button in the dataset toolbar (below the plotting area
in the plot window). This will reveal a new Point Labels
selector below the existing spatial ones.
Using this you can select any of the table columns (not just the
numeric ones as for the other selectors), or give a string or
numeric expression involving them. When this selector is filled
in, every point in the dataset which has a non-blank value for
this quantity will have it written next to the point on the display.
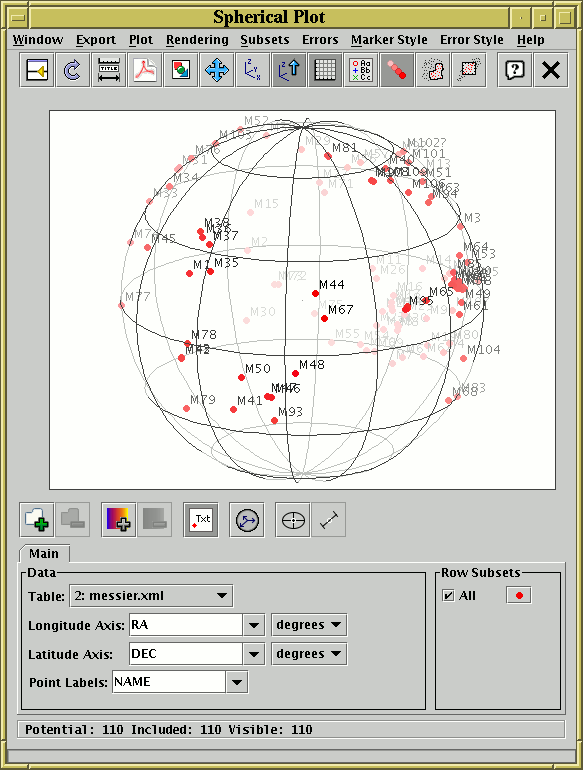
Point Labelling for Messier objects in the spherical plot
In this example the NAME column has been selected, so that each point plotted (in this case all the Messier objects) is labelled with its name. As you can see, where many labels are plotted near to each other they can get in each others' way. In some cases TOPCAT will omit plotting labels in crowded regions, in others not - but in any case if you have labels too tightly grouped they are unlikely to be legible.