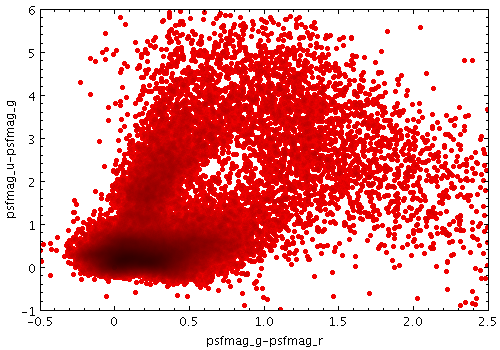
Example Auto shading mode plot
Example Auto shading mode plot
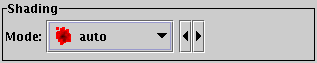
Auto shading mode selection
The Auto shading mode (![]() )
colours isolated points in their selected colour,
but where multiple points from the same data set
overlap it adjusts the colour by darkening it.
This means for that isolated points
(most or all points in a non-crowded plot, or outliers in a crowded plot)
it behaves just like Flat mode,
but it's easy to see where overdense regions lie.
)
colours isolated points in their selected colour,
but where multiple points from the same data set
overlap it adjusts the colour by darkening it.
This means for that isolated points
(most or all points in a non-crowded plot, or outliers in a crowded plot)
it behaves just like Flat mode,
but it's easy to see where overdense regions lie.
This is like Density mode, but with no user-configurable options.
This is the default mode for 2d plots, since it gives you a good first idea of what the data is doing. For 3d plots it can be used, and it works well for single dataset plots, but in the case of multiple datasets it can be misleading since the coloured pixels can't be placed sensibly in the 3d space.
The colour darkening is based on the asinh function; the intention is that two points overlaid should be just enough different in colour for the difference to be visible, and the mapping is scaled so that if there are very dense regions they will come out nearly black.
Exporting: When exported to vector formats, the output is automatically forced to a bitmap for Auto-mode layers. In the case of PostScript, this completely obscures any previous layers.