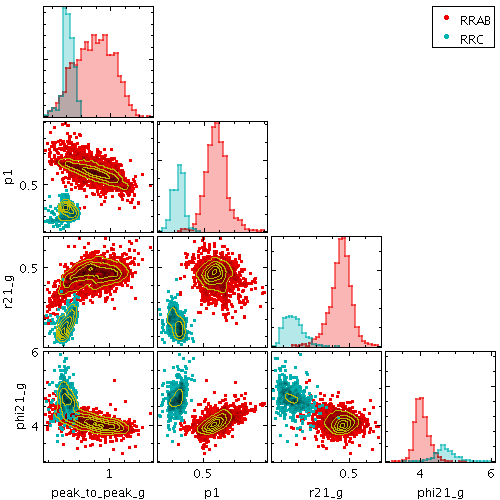
Example output from plot2corner.
plot2corner: Draws a matrix of plane plots
plot2corner
represents the relationships between multiple quantities
by drawing a scatter-like plot of every pair of coordinates,
and/or a histogram-like plot of every single coordinate,
and placing these on (half or all of) a square grid.
The horizontal coordinates of all the plots on each column,
and the vertical coordinates of all the plots on each row,
are aligned.
Single-coordinate (histogram-like) plots appear on the diagonal,
and coordinate-pair (scatter plot-like) plots appear off diagonal.
By default only the diagonal and sub-diagonal part of the resulting
plot matrix is shown, since the plots above the diagonal are equivalent
to those below it, but this is configurable.
This representation is variously known as a corner plot,
scatter plot matrix, splom or
pairs plot.
In principle any number of quantities can be simultaneously compared in this way, but depending on the output format, attempting to use too many may make the individual plots too small to be useful.
The number D of quantities to compare (the dimensionality of the
space from which you want to plot 2- and 1-dimensional projections)
is given by the nvar parameter.
Each specified layer then requires D positional coordinates,
given by the parameters x1, x2, ... xD.
The resulting grid of plots will have a linear dimension of D
if there are histogram-like layers included,
or D-1 if there are only scatter-plot like layers.
As well as the positional coordinate parameters xK themselves,
some of the other parameters are indexed by the coordinate index K
as well, for instance
xKlog, xKflip,
xKmin and xKmax.
Content is added to the plot by specifying
one or more plot layers using the
layerN parameter.
The N part is a suffix applied to
all the parameters affecting a given layer;
any suffix (including the empty string) may be used.
Available layers for this plot type are:
mark,
line,
linearfit,
label,
contour,
grid,
fill,
quantile,
histogram,
kde,
knn,
densogram,
gaussian,
function.
Example output from plot2corner.