The Frame control (![]() )
controls the graphical area on which the plot graphic is drawn.
It contains two tabs, Size and Title.
)
controls the graphical area on which the plot graphic is drawn.
It contains two tabs, Size and Title.
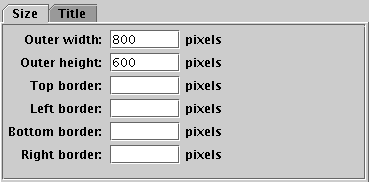
Frame control Size tab
The Size tab allows you to set the geometry of the generated plot in pixels. By default, the plot is simply resized to fit the current size and shape of the window. However, if you fill in the Outer width and/or Outer height fields, the size will instead be fixed to the given dimension in pixels. Note if you pick a large value, you may need to manually resize the window to see all of the plot. Similarly, the border fields fix the number of pixels surrounding the data region of the plot; if these are left blank, as by default, these borders are sized to accommodate the things that have to fit in them (such as axis annotations and the Aux axis colour ramp).
The main use for this tab is to fix the size and alignment of the generated images if you want to export a series of similar plots.
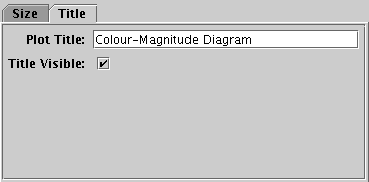
Frame control Title tab
The Title tab allows you to give a title for the plot. If text is filled in the Plot Title field, and if the Title Visible checkbox is checked, then the given text will appear at the top of the plot.
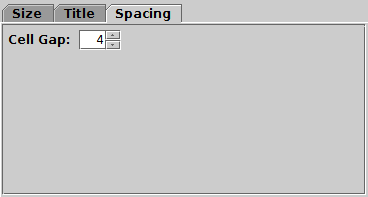
Frame control Spacing tab
For some plot types only, this tab provides options to control the spacing between elements of the plot. For the Time Plot it contains the Cell Gap option which controls the number of blank pixels between individual panels in the stack of plots. For other plot types this configuration is not relevant, or is available from the Axes control.