The Axes control (![]() ) for the
sky plot window has the following tabs:
) for the
sky plot window has the following tabs:
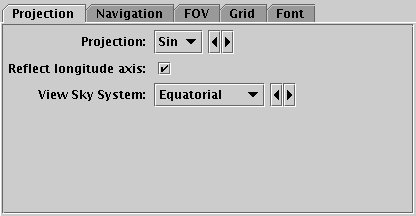
Projection tab of the sky Axes control
The Projection tab controls how the sky position coordinates are projected onto the screen.
       x = [2sqrt(2)/sqrt(1+cos(lat)cos(lon/2))]cos(lat)sin(lon/2)
       y = [sqrt(2)/sqrt(1+cos(lat)cos(lon/2))]sin(lat)
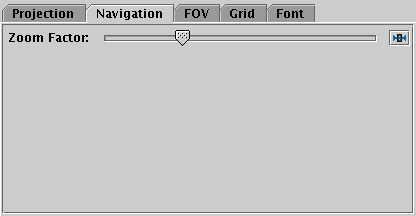
Navigation tab of sky Axes control
The Navigation tab controls details of how the navigation works. It has the following option:
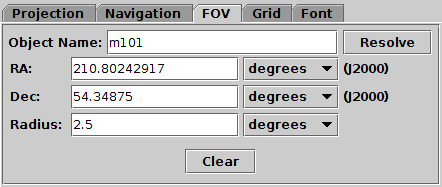
Field Of View tab of the sky Axes control
The FOV (Field Of View) tab allows you to enter a sky position or object name and a radius and positions the view at that region. Filling in the position and radius fields and hitting return will reposition the sky view, but not vice versa; normal pan/zoom operations will not affect the content of this panel.
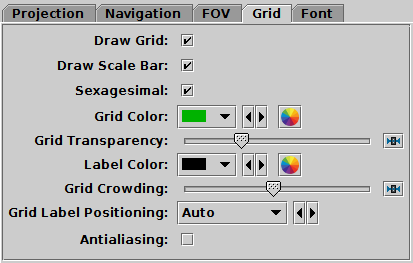
Grid tab of the sky Axes control
The Grid tab controls how the sky coordinate axes appear.
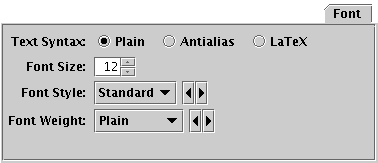
Font tab
The Font tab configures the font used for axis annotation. It also affects some other things like the legend.