Next Previous Up Contents
Next: Fill Form
Up: Plot Forms
Previous: SkyDensity Form
The SkyVecField form ( )
plots a field of arrows on a HEALPix grid corresponding to the
aggregated (typically averaged) value of a 2-d vector quantity
such as proper motion for the points in each HEALPix cell.
)
plots a field of arrows on a HEALPix grid corresponding to the
aggregated (typically averaged) value of a 2-d vector quantity
such as proper motion for the points in each HEALPix cell.
Currently, the visible length of the vectors is dependent on the
order of the grid; they are normalised to appear with a length comparable
to the size of the HEALPix pixels.
This length can be adjusted by use of the Scale control.
By default, the absolute values of the vectors are plotted.
However, if the Relative option is set,
the mean vector value averaged over the visible plot area
will be calculated and subtracted from all the plotted vectors.
The effect of this is to show local variations rather than absolute
values of the vectors over the visible area.
The value of such mean offsets is displayed in the
Report panel at the bottom of the layer control panel.
This form may be used in the Sky
plot window.
The VecField form does the same thing
for a Plane plot.
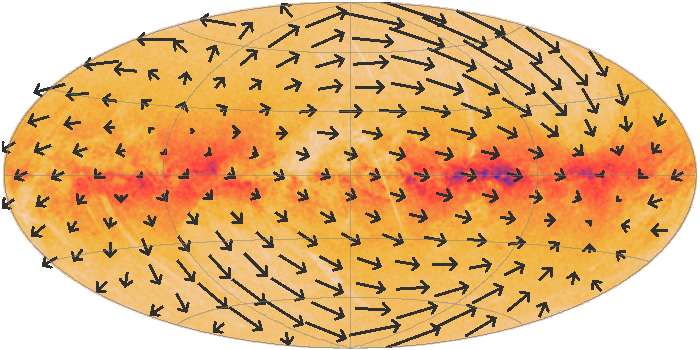
Example SkyVecField plot
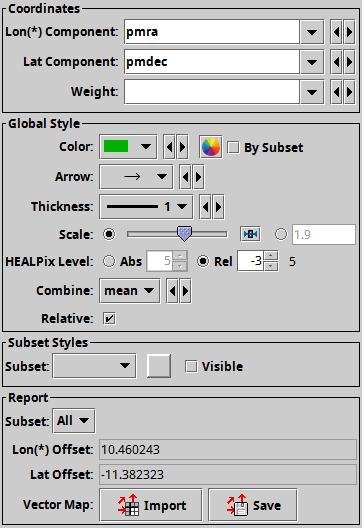
SkyVecField form configuration panel
The configuration options are:
-
Lon(*) Component
-
Lat Component
- Longitude and Latitude Components of the vector values
to combine per cell and plot.
The longitude value is considered to be pre-multiplied by cos(lat).
Since these values are normalised before plotting,
units are not significant.
-
Weight
- An optional weighting to apply to each vector.
-
Color
- Colour of the arrows.
-
Arrow
- Arrow shape selected from a range of options.
-
Thickness
- Controls the line thickness used when drawing arrows.
Zero, the default value, means a 1-pixel-wide line is used,
and larger values make drawn lines thicker.
-
Scale
- Changes the factor by which all vector lengths are scaled.
If the arrows are too small, slide it right, if they are too big,
slide it left. The slider scale is logarithmic.
Alternatively, enter a fixed value in the text field.
The default value of unity corresponds to vectors that are
a sensible size for the current HEALPix grid.
-
Healpix Level
- This allows you to control the resolution of the HEALPix grid
onto which the weighted values are resampled.
According to the radio buttons, you can configure this using either
a Absolute or Relative value.
In Absolute mode you specify the HEALPix level (k) directly;
the number of pixels on the sky is 12*22k.
In Relative mode the level is set so that a HEALPix tile has
approximately the given number of screen pixels along a side,
and hence the absolute level will change if you zoom in and out.
In either case, you can see the absolute level at the right hand side
of the control.
-
Combine
- How the vectors in each HEALPix cell are combined to determine the
plotted vector in that cell.
By default this is Mean, but Sum
is also an option.
-
Relative
- If true, the mean value for all the vectors in the field of view
is calculated and subtracted from each displayed vector.
The effect of this is to show local variations rather than absolute
values of the vectors over the visible area.
The value of such mean offsets is displayed in the
Report panel below the configuration controls.
The Report gives you access to the calculations
made during plotting:
-
Lon(*) Offset
-
Lat Offset
- If the Relative option is selected,
these quantities report the field of view averaged values
that have been subtracted from per-cell values before plotting.
-
Vector Map
- This allows you to export the vectors that you can see in the plot
in the form of a table.
The current implementation writes the table for the whole sky,
not just the cells that are visible in the current plot.
The table has a row for each healpix pixel;
depending on how sparse the data is the HEALPix index might be implicit
(corresponding to row index) or explicitly given as a column value.
There are also columns giving the aggregated longitude and latitude
values for each cell.
The Import (
 ) option
loads the data as a new table in the TOPCAT application, and
the Save (
) option
loads the data as a new table in the TOPCAT application, and
the Save ( ) option
lets you save it directly to disk in one of the available table formats.
These options are also available from the Export menu.
) option
lets you save it directly to disk in one of the available table formats.
These options are also available from the Export menu.
Some notes apply for this export:
- If you want to export the table following the
HEALPix-FITS convention
in a form suitable for use in other applications such as Aladin,
you should save it using the output format fits-healpix
rather than one of the other FITS variants.
- When exported as FITS, the sky coordinate system
(FITS
COORDSYS header) is determined by the current
value of the View Sky System, as reported in the
Sky Axes Control.
- The HEALPix level at which the data is exported is that currently
plotted as reported by the HEALPix Level report item
above, not necessarily the one selected in the style configuration
controls.
Next Previous Up Contents
Next: Fill Form
Up: Plot Forms
Previous: SkyDensity Form
TOPCAT - Tool for OPerations on Catalogues And Tables
Starlink User Note253
TOPCAT web page:
http://www.starlink.ac.uk/topcat/
Author email:
m.b.taylor@bristol.ac.uk
Mailing list:
topcat-user@jiscmail.ac.uk