Next Previous Up Contents
Next: Error Bars Form
Up: Plot Forms
Previous: Vector Form
The SkyVector form ( )
plots directed lines from the data position
given relative offsets to longitude.cos(latitude) and latitude
on the celestial sphere.
The plotted markers are typically little arrows, but there are
other options.
)
plots directed lines from the data position
given relative offsets to longitude.cos(latitude) and latitude
on the celestial sphere.
The plotted markers are typically little arrows, but there are
other options.
In some cases such delta values may be the actual magnitude required
for the plot, but often the vector data represents a value which
has a different magnitude or is in different units to the positional data
(for instance proper motions).
As a convenience for this case, the plotter can optionally
scale the magnitudes of all the vectors to make
them a sensible size (so the largest ones are a few tens of pixels long).
This scaling can be adjusted or turned off using the
Scale and Auto Scale options below.
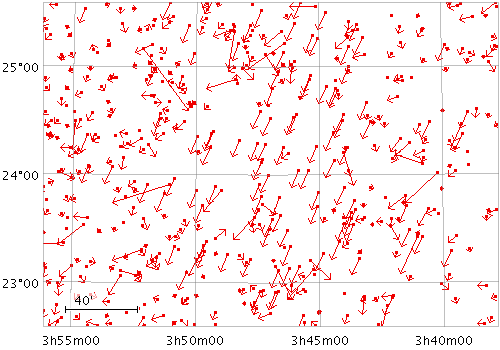
Example SkyVector plot
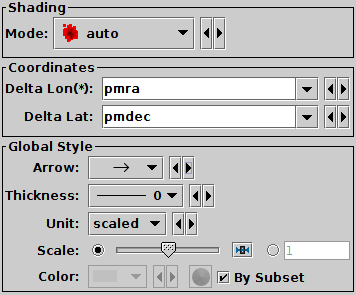
SkyVector form configuration panel
The configuration options are:
-
Shading Mode
- See Appendix A.4.6.
-
Delta Lon(*)
- Change in the longitude coordinate represented by the plotted vector.
The supplied value is (if not auto-scaled) an angle in degrees,
and is considered to be premultiplied by cos(Latitude).
-
Delta Lat
- Change in the latitude coordinate represented by the plotted vector.
The supplied value is (if not auto-scaled) an angle in degrees.
-
Arrow
- Arrow shape selected from a range of options.
-
Thickness
- Controls the line thickness used when drawing arrows.
Zero, the default value, means a 1-pixel-wide line is used,
and larger values make drawn lines thicker.
-
Scale
- Changes the factor by which all vector sizes are scaled.
If the arrows are too small, slide it right, if they are too big,
slide it left. The slider scale is logarithmic.
Alternatively, enter a fixed value in the text field.
-
Auto Scale
- If selected, this option will determine the default arrow scale size
from the data - it will fix it so that the largest arrows are a
few tens of pixels long by default.
That scaling can then be adjusted using the Scale slider.
If unselected, then the default position of the Scale slider corresponds
to the actual values in degrees given by the submitted Delta Lon/Lat
coordinates.
Next Previous Up Contents
Next: Error Bars Form
Up: Plot Forms
Previous: Vector Form
TOPCAT - Tool for OPerations on Catalogues And Tables
Starlink User Note253
TOPCAT web page:
http://www.starlink.ac.uk/topcat/
Author email:
m.b.taylor@bristol.ac.uk
Mailing list:
topcat-user@jiscmail.ac.uk