Next Previous Up Contents
Next: Histogram Style Editor
Up: Old-Style Plot Windows
Previous: Exporting Graphics
This section describes an old-style plotting window.
The standard plotting windows are described in Appendix A.4.
Histogram Window
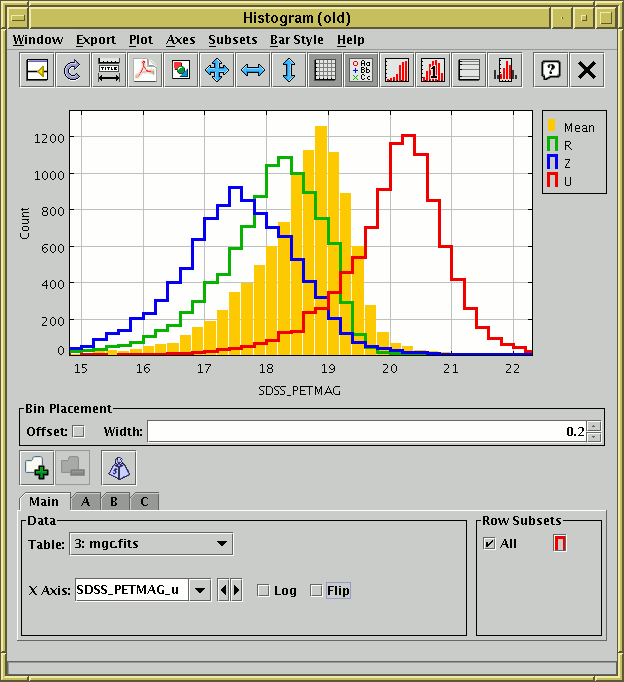
The histogram window lets you plot histograms of one or more
columns or derived quantities.
You can display it using the Histogram ( )
item in the Control Window's
Graphics menu.
)
item in the Control Window's
Graphics menu.
You select the quantity or quantities to plot using the
dataset selector
at the bottom of the window.
You can configure the axes, including zooming in and out,
with the mouse (drag on the plot or the axes)
or manually as described in Appendix A.5.1.2.
The Bin Placement box below the main plot controls
where the bars are drawn. Select the horizontal range of each bar
using the Width entry box - either type in the value
you want or use the tiny up/down arrows at the right to increase/decrease
the bin size.
The Offset checkbox on the left determines where the zero
point on the horizontal axis falls in relation to the bins;
if the box is checked then zero (or one for logarithmic X axis)
is in the centre of a bin, and if it's unchecked then zero (or one)
is on a bin boundary.
The following buttons are available on the toolbar:
-
 Split Window
- Allows the dataset selector to be resized by dragging a separator
between it and the plot area. Good for small screens.
-
 Replot
- Redraws the current plot. It is usually not necessary to
use this button, since if you change any of the plot characteristics
with the controls in this window the plot will be redrawn
automatically. However if you have changed the data, e.g. by
editing cells in the Data Window,
the plot is not automatically redrawn (since this is potentially an
expensive operation and you may not require it).
Clicking this button redraws the plot taking account of any changes
to the table data.
-
 Configure Axes and Title
- Pops up a dialogue to allow manual configuration of axis ranges,
axis labels and plot title - see Appendix A.5.1.2.
-
 Export as PDF
- Pops up a dialogue which will write the current plot as a PDF file.
-
 Export as GIF
- Pops up a dialogue which will output the current plot to a GIF file.
The output file is just the same as the plotted image that you see.
Resize the plotting window before the export to control the size
of the output GIF.
-
 Rescale
- Rescales the axes so that the width and height are sufficient to
accommodate all the non-zero bars in the histogram for all the currently
selected datasets.
By default the plot will be scaled like this, but it it may have changed
because of changes in the subset selection or from zooming in or out.
-
 Rescale X
- Rescales the horizontal axis to accommodate all the
currently plotted bars.
The vertical axis scaling is not changed.
-
 Rescale Y
- Rescales the vertical axis to accommodate all the
currently plotted bars.
The horizontal axis scaling is not changed.
-
 Grid
Grid
- Toggles whether a grid is drawn over the plotting surface or not.
-
 Show Legend
- Toggles whether a legend showing how each data set is represented
is visible to the right of the plot. Initially the legend is shown
only if more than one data set is being shown at once.
-
 Cumulative Plot
- Toggles whether the histogram should be normal or cumulative.
Normally the height of each bar is determined by counting the
number of points which fall into the range on the X axis that it covers.
For a cumulative plot, the height is determined by counting all the
points between negative infinity and the upper bound of the range on
the X axis that it covers.
-
 Normalisation
- Toggles whether histograms are normalised.
When selected, each dataset will be normalised so that the sum of
the counts of all its bars over the whole range of data is equal to one.
-
 Log Y Axis
- Toggles whether the Y axis is scaled logarithmically or not.
-
 Subset From Visible
- Defines a new Row Subset consisting of only the
data in the bars which are visible in the current plot.
See Appendix A.5.1.6 for more explanation.
The Dataset Toolbar contains the following options:
-
 /
/  Add/Remove dataset
- Adds/removes tabs in which the data for extra datasets can be entered.
See Appendix A.5.1.1.
-
 Weight Counts
- If this toggle button is on, an additional Weight Axis
selector appears below the X Axis selector.
If this is filled in with a column name or expression, then instead of
simply accumulating the number of points per bin, the Y axis will
show the sum over the weighting quantity for points in each bin.
Not having a weight axis is equivalent to filling in its value with
the quantity 1.
Note that with weighting, the figure drawn is no longer strictly speaking
a histogram.
When weighted, bars can be of negative height. An anomaly of the
plot as currently implemented is that the Y axis never descends below
zero, so any such bars are currently invisible.
This may be amended in a future release
(contact the author to vote for such an amendment).
The Export menu contains additional image export
options and the following options specific to the histogram:
-
 Save as Table
- The bin counts/sums corresponding to the currently plotted histogram
will be written to disk in tabular form. The first two columns give
the lower and upper bounds of each bin, and the subsequent columns
give the occupancies of each bin for each plotted data set.
If only one dataset is plotted, there will only be three columns.
-
 Import as Table
- Assembles a table as per the Save option above,
but rather than writing it to disk imports it directly into TOPCAT,
where it can be manipulated in all the usual ways.
You have considerable freedom to configure how the bars are drawn;
controlling this is described in the following subsection.
Next Previous Up Contents
Next: Histogram Style Editor
Up: Old-Style Plot Windows
Previous: Exporting Graphics
TOPCAT - Tool for OPerations on Catalogues And Tables
Starlink User Note253
TOPCAT web page:
http://www.starlink.ac.uk/topcat/
Author email:
m.b.taylor@bristol.ac.uk
Mailing list:
topcat-user@jiscmail.ac.uk