Next Previous Up Contents
Next: Sphere Navigation
Up: Plot Windows
Previous: Cube Axes Control
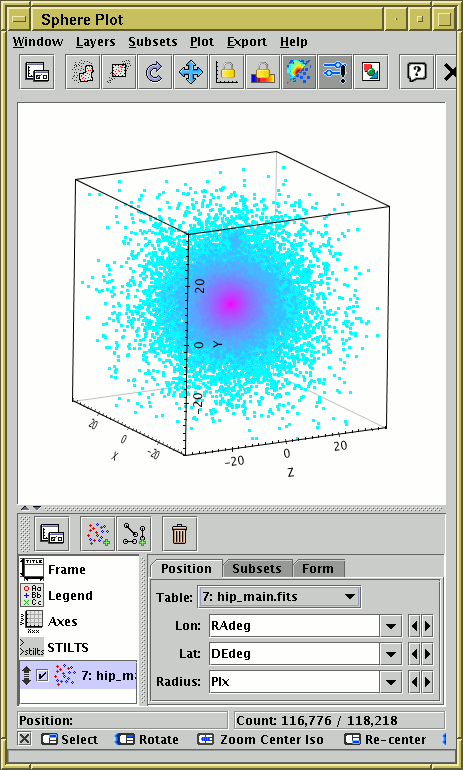
Sphere Plot Window
The Sphere Plot ( )
plots spherical polar coordinates in an isotropic 3-dimensional space.
Although the supplied coordinates are spherical polar,
the visible space is not necessarily centred on the coordinate origin,
and the visible axes are Cartesian.
In many respects this works like the
Cube Plot Window
)
plots spherical polar coordinates in an isotropic 3-dimensional space.
Although the supplied coordinates are spherical polar,
the visible space is not necessarily centred on the coordinate origin,
and the visible axes are Cartesian.
In many respects this works like the
Cube Plot Window
The positional coordinates are
Longitude and Latitude (in degrees) and
Radius.
The sphere plot offers the following plot controls:
Note that use of the
Auto,
Density and
Weighted
shading modes can be confusing in 3 dimensions with multiple datasets.
This is because pixels based on density along a line of sight are not
located at any point on that line, so shaded pixels can't appear
at the "right" place in the 3-d space. The same applies to a lesser
extent with contours. They work fine with a single dataset though.
See the Window Overview
for features common to all plotting windows.
The following subsections describe
navigation and
axis configuration.
Next Previous Up Contents
Next: Sphere Navigation
Up: Plot Windows
Previous: Cube Axes Control
TOPCAT - Tool for OPerations on Catalogues And Tables
Starlink User Note253
TOPCAT web page:
http://www.starlink.ac.uk/topcat/
Author email:
m.b.taylor@bristol.ac.uk
Mailing list:
topcat-user@jiscmail.ac.uk