Corner Plot Window
Corner Plot Window
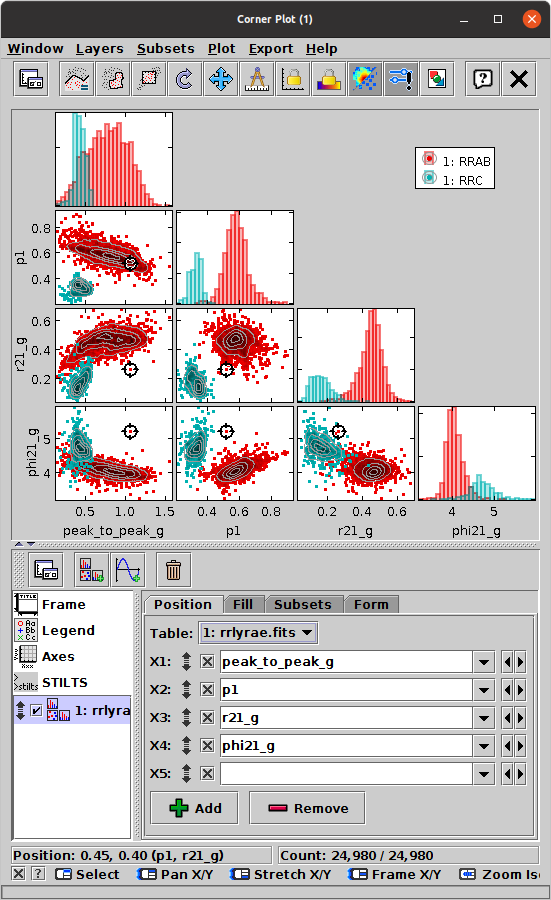
The Corner Plot (![]() )
represents the relationships between multiple quantities
by drawing a scatter-like plot of every pair of coordinates,
and/or a histogram-like plot of every single coordinate,
and placing these on (half or all of) a square grid.
The horizontal coordinates of all the plots on each column,
and the vertical coordinates of all the plots on each row,
are aligned.
The plots are all linked, so you can
make graphical selections
or click on a point to activate it
in one of the panels, and the other panels will immediately
reflect that action.
Single-coordinate (histogram-like) plots appear on the diagonal,
and coordinate-pair (scatter plot-like) plots appear off diagonal.
By default only the diagonal and sub-diagonal part of the resulting
plot matrix is shown, since the plots above the diagonal are equivalent
to those below it, but this is configurable.
This representation is variously known as a corner plot,
scatter plot matrix, splom or
pairs plot.
)
represents the relationships between multiple quantities
by drawing a scatter-like plot of every pair of coordinates,
and/or a histogram-like plot of every single coordinate,
and placing these on (half or all of) a square grid.
The horizontal coordinates of all the plots on each column,
and the vertical coordinates of all the plots on each row,
are aligned.
The plots are all linked, so you can
make graphical selections
or click on a point to activate it
in one of the panels, and the other panels will immediately
reflect that action.
Single-coordinate (histogram-like) plots appear on the diagonal,
and coordinate-pair (scatter plot-like) plots appear off diagonal.
By default only the diagonal and sub-diagonal part of the resulting
plot matrix is shown, since the plots above the diagonal are equivalent
to those below it, but this is configurable.
This representation is variously known as a corner plot,
scatter plot matrix, splom or
pairs plot.
In principle any number of quantities can be simultaneously compared
in this way, but attempting to use too many will make
the individual plots too small to be useful.
Depending on the size of your screen, you may find about 20 is a
reasonable upper limit, though more detail will be visible with fewer.
Note that the Float Controls (![]() ) button
(or equivalent action in the Window menu)
can be used to detach the control panel from the plot display and so
free up more space for the visualisation itself.
) button
(or equivalent action in the Window menu)
can be used to detach the control panel from the plot display and so
free up more space for the visualisation itself.
By default the linear size of the plot grid will be defined
by the highest-numbered non-blank coordinate that is visible
in any of the active Position layer controls,
but it can be adjusted directly in the Axes control
(![]() ).
).
The configuration of the plots is done in the same way as for the Plane Plot, and many of the plot types that are available there can be used in the grid cells of this plot. The Corner Plot currently offers the following plot controls:
As well as the standard actions, this window additionally provides the following toolbar buttons:
See the Window Overview for features common to all plotting windows. The following subsections describe navigation and axis configuration.
Note: the Corner Plot Window is new at TOPCAT version 4.9. Some of the features are experimental and may be changed in future releases.